
A brand owner from Berlin once asked me a question that revealed a deep misunderstanding of how a factory learns. He had been working with us for three seasons. His orders were consistently on time and on quality. He said, "You guys just seem to get it right. What's your secret?" I told him there is no secret. There is data. Every stitch, every seam, every inspection result, every delivery date from the last ten years is recorded. When his new order comes in, we do not start from zero. We start from a thousand data points that tell us exactly what worked, what failed, and what needs to change.
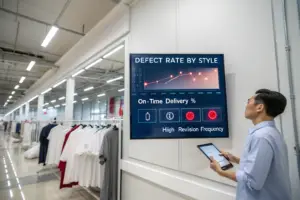
Shanghai Fumao uses historical production data to improve future order accuracy by analyzing patterns across three key datasets: defect and revision frequency by style and fabric type, time and material consumption variances against initial estimates, and client-specific communication and specification history. This analysis allows us to adjust future quotations, timelines, and quality control plans based on empirical evidence rather than estimates. A blazer that historically required 3.2 sampling iterations is quoted with a realistic sampling timeline, not an optimistic two-round estimate. A fabric that historically lost 8% to wastage is costed at 8% wastage, not a generic 5%. The data de-risks the order for both the factory and the brand owner.
The garment industry has traditionally relied on experience and intuition. The old pattern maker "just knows" how a fabric will behave. The production manager "has a feeling" about which styles will be problematic. Experience is valuable, but it is also subjective, inconsistent, and lost when the experienced person retires or leaves. Data is objective, consistent, and permanent. It allows the factory to learn systematically, not anecdotally. At Shanghai Fumao, we have invested in capturing, storing, and analyzing our production data. Let me show you how that data translates into more accurate orders for our brand partners.
What Key Data Points Do We Capture from Every Completed Production Run?
The first step in using historical data is capturing it. After every production run is completed, our production coordinator, QC manager, and pattern maker conduct a formal post-production review. This is not a casual chat. It is a structured data entry session where specific, pre-defined data points are recorded into our production database. The data is not just about what went wrong. It is about what happened, objectively.
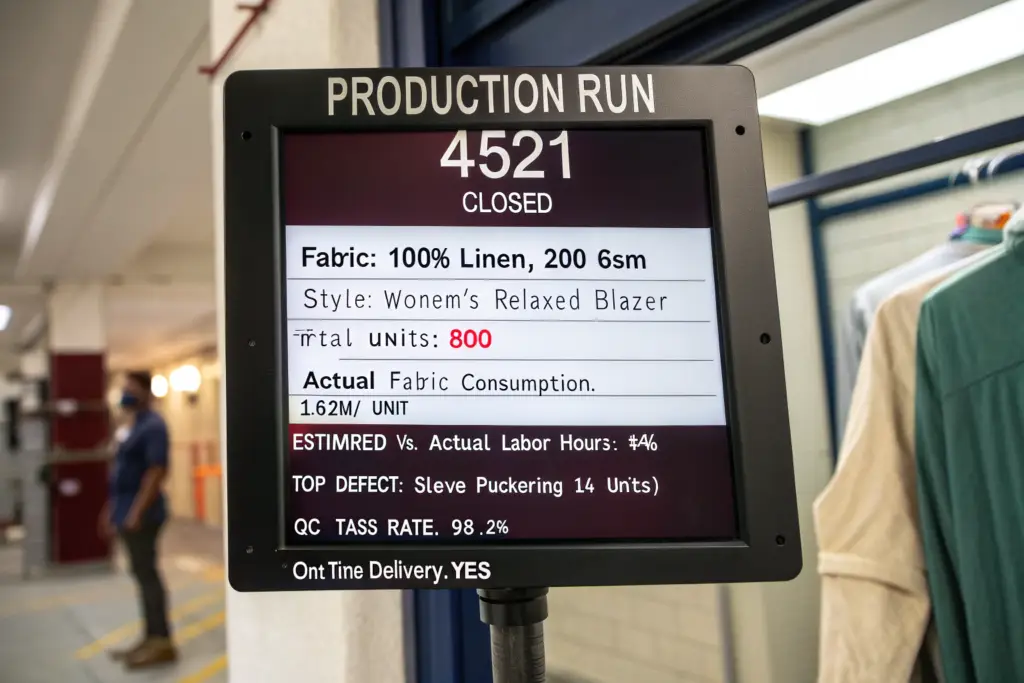
The key data points captured from every completed production run include the actual fabric consumption per unit, the total labor hours per operation, the defect rate and defect type distribution, the number of sample revisions and the primary reasons for revision, the on-time delivery performance, and any supply chain disruptions encountered. This data is tagged by style category, fabric type, and client. Over time, the database accumulates a granular, searchable record of how every combination of fabric, design, and production line performed in reality, not just in the initial estimate.
Capturing this data requires discipline. The production coordinator must record the actual fabric issued from the warehouse, not just the theoretical marker consumption. The QC manager must classify every defect found at inline and final inspection, not just record a pass/fail. The pattern maker must document the specific pattern changes made at each sample revision, not just the fact that a revision occurred. The discipline of accurate, granular data entry is the foundation of the entire system.
How Do We Track "Fabric Utilization Rate" Across Different Weaves and Blends?
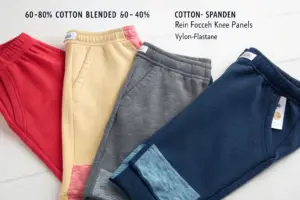
Fabric utilization rate is the percentage of the total fabric purchased that actually ends up in finished, saleable garments. The difference between the fabric purchased and the fabric utilized is wastage. Wastage occurs at the cutting table, through end-of-roll losses, through fabric defects, and through cutting errors. It is a significant cost driver.
Our cutting room records the exact meterage of fabric issued from the warehouse for each production run. After cutting, the cut panels are counted, and the actual fabric consumption per garment is calculated. The difference between the issued meterage and the theoretical consumption is the wastage. This wastage percentage is recorded and tagged to the specific fabric type.
A heavy wool coating from a particular mill might consistently show a 7% wastage rate due to the way the fabric is rolled and the frequency of minor weave flaws near the roll ends. A lightweight silk charmeuse might show a 12% wastage rate due to the difficulty of cutting a slippery, shifting fabric accurately. A stable cotton poplin might show a 3% wastage rate.
When the same fabric is reordered for a future production run, the quotation uses the historical wastage percentage, not a generic, optimistic estimate. If the brand owner's order requires 500 meters of finished fabric based on the marker calculation, and the historical wastage for that fabric is 7%, the quotation is based on purchasing 535 meters. The brand owner's cost is accurate. The factory's margin is protected from an unexpected fabric shortfall.
A brand owner's linen blazer order was quoted based on our historical linen wastage data. The fabric had a historical wastage of 9%, significantly higher than the 5% generic estimate. The brand owner initially questioned why the fabric cost seemed high. We showed him the data. He understood. The order was produced with zero fabric shortage. A factory quoting a generic 5% wastage on that linen would have run out of fabric and delayed the order.
What Is "Revision Cycle Analysis" and How Does It Refine Our Initial Quotes?
Revision cycle analysis tracks the number of sample revisions, proto, fit, PP, that were required for each style in the database. The data includes the reason for each revision, the specific pattern or construction change made, and the time and cost consumed by the revision cycle.
The analysis reveals patterns. Structured blazers, across multiple clients and multiple seasons, consistently require an average of 3.2 revision cycles from proto to PP approval. Simple knit tops require an average of 1.4 revision cycles. A brand owner who is developing a complex tailored jacket with us for the first time will receive a sampling timeline and a sampling cost estimate that reflects the 3.2-cycle historical average, not an optimistic 2-cycle estimate that would set unrealistic expectations.
The analysis also reveals client-specific patterns. Some brand owners consistently require more revision cycles than the category average because they are more detail-oriented, or because their tech packs are less complete. The data captures this. A client with a history of 4.5 average revisions on blazers will receive a quote that reflects their specific historical pattern. The quote is personalized, not generic.
This data-driven approach protects both the brand owner and the factory. The brand owner receives a realistic timeline and cost estimate. The factory is not squeezed by an under-quoted sampling budget. The relationship is built on transparency and shared data, not on optimistic assumptions that lead to disappointment.
A new brand client was surprised when our sampling quote for her structured jacket included three revision cycles and a buffer. She asked why other factories had quoted two cycles. We showed her the aggregated, anonymized data on jacket sampling cycles across our client base. She accepted the realistic timeline. The jacket required exactly three revisions, as predicted. The buffer was partially used. The sampling phase was completed on time and on budget.
How Does Historical Defect Data Reshape Our Quality Control Checkpoints?
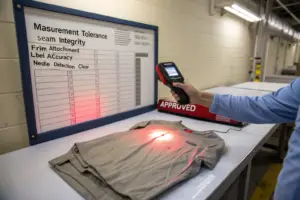
A static quality control plan applies the same inspection checkpoints to every garment of a given type, regardless of the specific fabric, design, or production history. A data-driven quality control plan adapts the inspection checkpoints based on the historical defect patterns for that specific combination of variables. The QC resources, the inspectors' time and attention, are concentrated on the operations and the areas of the garment that the data shows are most likely to fail.
Historical defect data reshapes our QC checkpoints by identifying the specific operations, fabric types, and garment areas that have generated the highest defect rates in past production runs. If the data shows that a particular fabric, such as a lightweight, slippery viscose, consistently generates seam puckering at the armhole, the inline QC checkpoint for that operation is elevated from a random sample check to a 100% check for all future orders using that fabric. If the data shows that button attachment on a specific style of jacket has a higher-than-average failure rate, the final inspection pull-test sample size is increased for that style. The QC system learns from every defect. It becomes progressively more targeted and effective with each production run.
This adaptive QC system is a competitive advantage. A factory with a static QC plan is inspecting yesterday's problems. A factory with a data-driven QC plan is inspecting tomorrow's risks. The brand owner benefits from a lower defect rate and a higher first-pass quality yield.
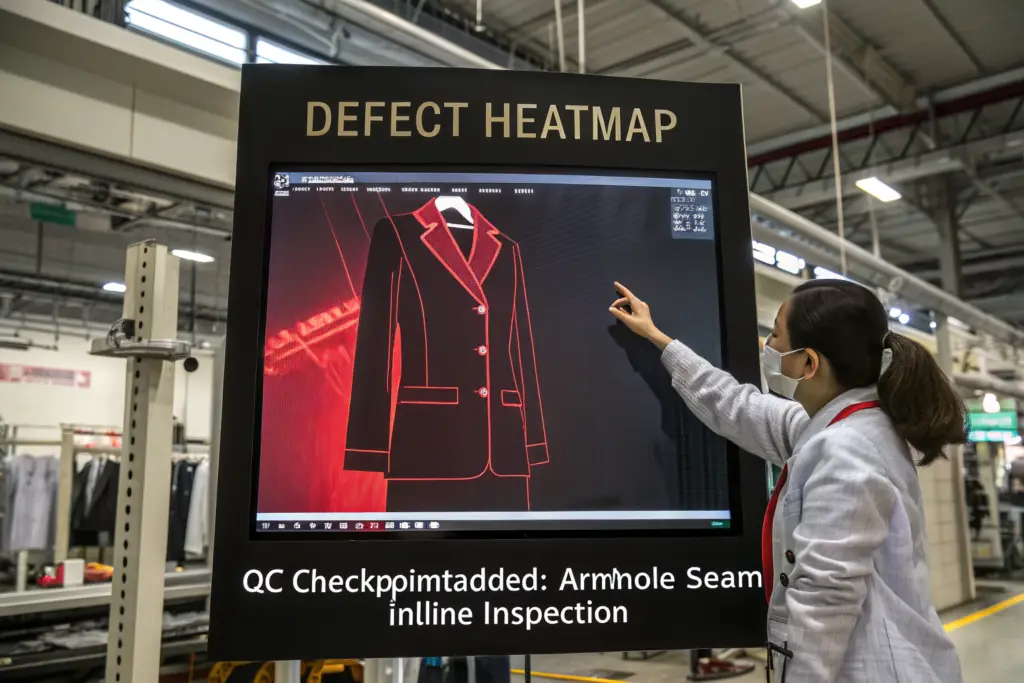
How Can a "Defect Heatmap" Predict Problem Areas for a Repeat Style?
A defect heatmap is a visual representation of defect frequency overlaid onto a garment sketch. Each area of the garment, collar, shoulder, armhole, pocket, hem, is color-coded based on the historical defect rate for that area on that specific style or similar styles. Green indicates a low defect rate. Yellow indicates an elevated rate. Red indicates a high rate requiring focused attention.
When a style is reordered, the production team pulls up the defect heatmap from the previous production run. The heatmap shows exactly where the problems occurred last time. The collar attachment had a 4% defect rate, red. The side seam had a 0.5% defect rate, green. The production manager adjusts the inline QC checkpoints for the reorder. The collar attachment station gets an additional, dedicated inline inspector. The sewing supervisor is briefed on the collar issue and retrains the operators on that specific operation before the line starts.
The defect heatmap transforms the reorder from a repeat of the same process into an improved process. The factory does not just make the same garment again. It makes a better version of the garment, informed by the data from the last version. The brand owner benefits from a continuously improving quality curve.
A brand owner reorders a bestselling men's shirt with us each season. After the first production run, the defect heatmap showed a cluster of defects at the sleeve placket. The placket attachment is a complex, multi-step operation. For the second run, we added a dedicated inline QC check at the placket station and provided additional operator training. The placket defect rate dropped by 70%. The brand owner noticed the improved consistency. The data had quietly improved his product.
What Threshold of Historical Returns Triggers a Proactive Material Substitution?
When a specific fabric or trim consistently generates a higher-than-acceptable return rate or defect rate across multiple production runs, the data triggers a proactive conversation with the brand owner about a material substitution. The factory does not simply continue using the problematic material and accepting the defect cost. The data drives a preventive action.
The threshold for triggering this conversation is typically a defect or return rate that is double the baseline for comparable materials, sustained over at least two production runs. The data must show a clear, repeatable pattern, not a single bad batch.
The conversation is data-driven. "The matte black resin buttons specified on Style #2406 have a 3.2% failure rate across the last two production runs, compared to a 0.8% average for our standard horn buttons. The failure mode is cracking at the attachment point. We recommend switching to a genuine horn button in a similar dark finish, which has a 0.5% failure rate. The cost difference is $0.12 per unit. Here is a sample of the recommended button."
The brand owner is presented with the evidence, the recommendation, and the cost impact. The decision is theirs. The factory's role is to surface the data and propose the solution. Most brand owners, when presented with clear data, choose the more reliable material.
A brand owner's jacket lining was a polyester satin that consistently generated returns for static cling and poor breathability. Our data showed a 4% return rate attributed to the lining. We recommended a switch to a Bemberg cupro lining. The cost increase was $0.85 per jacket. The brand owner approved the switch. The return rate on the next production run dropped to 0.5%. The data-driven material substitution improved the consumer experience and the brand owner's profitability.
How Do Time-and-Motion Studies from Past Orders Optimize Future Pricing?
The labor cost of a garment is driven by the time required to sew it. The time required is driven by the number of operations, the complexity of each operation, and the fabric's handling characteristics. An accurate labor cost requires an accurate time estimate. An inaccurate time estimate leads to either an uncompetitive price, if the estimate is too high, or a money-losing price for the factory, if the estimate is too low.
Time-and-motion studies from past orders optimize future pricing by providing a library of measured, validated Standard Minute Values, SMVs, for specific operations on specific fabric types. When a new order is quoted, the costing team does not guess how long the sleeve-setting operation will take. They look up the SMV for sleeve-setting on a similar fabric weight and weave from the historical database. The SMV is multiplied by the labor cost per minute to calculate the labor cost for that operation. The total labor cost is the sum of the SMV-based estimates for all operations. The quoted price is grounded in empirical time data, not in the production manager's intuition.
The SMV database is built through direct observation and measurement. An industrial engineer records video of an experienced operator performing each operation. The video is analyzed to determine the standard time for a qualified operator working at a normal pace, with appropriate allowances for fatigue and personal needs. The SMV is the benchmark.
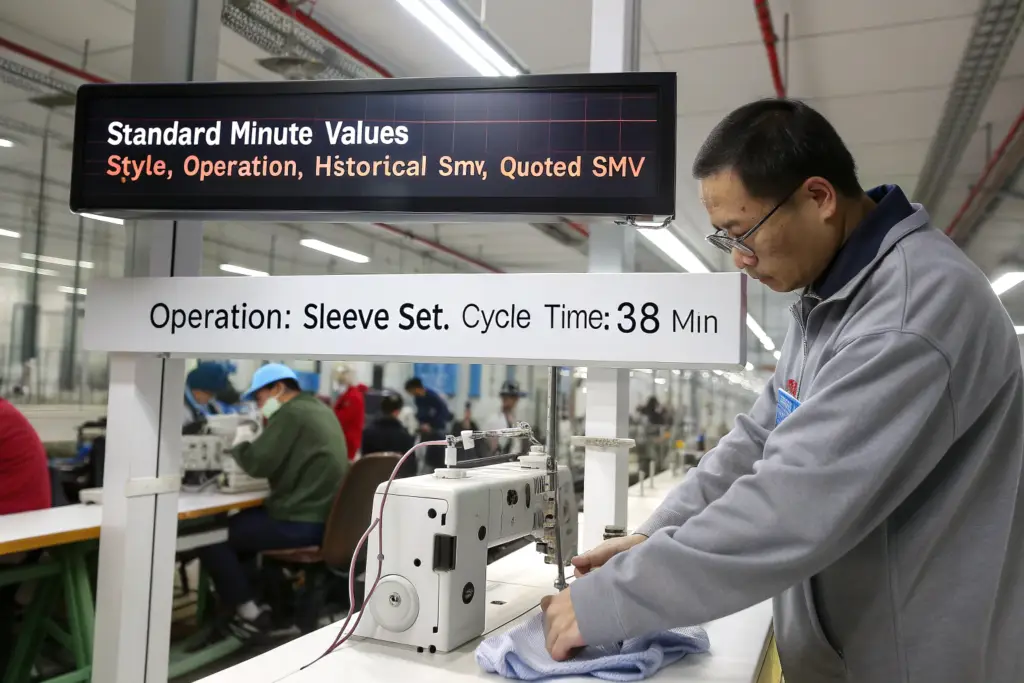
What Is the "Standard Minute Value" and How Is It Calculated from Shop Floor Data?
The Standard Minute Value, or SMV, is the time, in minutes, that a qualified operator requires to perform a specific sewing operation at a standard pace, including allowances. It is the fundamental unit of labor cost in garment manufacturing.
The SMV is not simply the average time observed. It is calculated using a standardized methodology, often based on the GSD, General Sewing Data, system or a similar predetermined motion-time system. The operation is broken down into its constituent motions, reach, grasp, align, sew, trim, dispose. Each motion is assigned a standard time based on its difficulty and distance. The sum of the motion times, plus allowances, is the SMV.
The SMV is validated against actual shop floor performance. If the calculated SMV for an operation is 2.5 minutes, and skilled operators consistently complete it in 2.0 minutes, the SMV may be adjusted, or the discrepancy may indicate that the operators are rushing and quality may suffer. The SMV is a management tool, not just a costing tool.
Our SMV database contains values for hundreds of specific operations on dozens of fabric types. When a new style is quoted, the costing team builds the labor cost estimate operation by operation, using the relevant SMVs. The process is systematic and data-driven.
How Does This Data Allow Us to Offer Volume Discounts Without Sacrificing Our Margin?
Volume discounts are a standard expectation in garment sourcing. A larger order allows the factory to spread the fixed setup costs over more units, reducing the per-unit cost. The SMV data allows us to calculate exactly how much the labor cost per unit decreases with volume, and to offer a discount that reflects the genuine efficiency gain, without eroding our margin.
The key efficiency gains from volume are operator learning and line balancing. When an operator repeats the same operation hundreds or thousands of times, their speed increases as they develop muscle memory and eliminate micro-inefficiencies. The SMV data captures this learning curve. The first 100 units have a higher effective labor time per unit than the next 900 units.
Similarly, a longer production run allows the line to achieve a perfect balance. The initial hours of a run are spent fine-tuning the work allocation. The later hours run at peak efficiency. The SMV data allows us to model the efficiency profile of the run based on the order quantity.
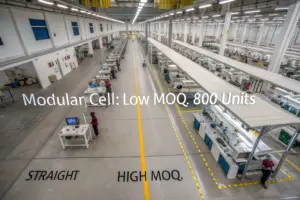
The volume discount we offer is based on the modeled efficiency gain. A 300-unit order might have an efficiency factor of 85% of the SMV, meaning the effective labor time is 85% of the standard. A 1,200-unit order might have an efficiency factor of 72% of the SMV, reflecting the learning and balancing benefits. The price difference between the two orders is the genuine labor cost difference, not an arbitrary negotiation concession.
A brand owner increasing his order from 400 to 1,000 units expected a 10% price reduction. Our SMV-based costing showed the genuine labor efficiency gain was 6%. We offered a 6% discount. He asked why not 10%. We showed him the SMV data and the efficiency curve. He accepted the 6%. The discount was fair, transparent, and left both parties with a healthy margin.
How Can You, the Brand Owner, Access and Leverage This Data for Your Next Order?
The production data we collect is not a proprietary secret. It is a shared asset that benefits both the factory and the brand owner. A brand owner who understands their own production history, their average defect rates, their revision cycle patterns, their fabric performance data, can design better products, plan more realistic timelines, and negotiate more effectively with their own retail customers.
A brand owner can access and leverage our historical production data by requesting a pre-production data review before a new order is confirmed. We will provide the historical performance data for the specific style, fabric, and product category, including the expected revision cycles, the fabric wastage rate, the likely defect pattern, and the realistic production lead time based on comparable past orders. The brand owner can also request a post-production data report after each order is completed, which becomes their own internal database for future planning. The data empowers the brand owner to make evidence-based decisions, rather than relying on gut feel or the supplier's verbal assurances.
The data conversation is a partnership conversation. It moves the relationship from a transaction, "I will make this for this price," to a collaboration, "Here is what the data tells us about how to make this successfully." The brand owner who engages with the data is a more informed, more effective partner.

What Questions Should You Ask Your Supplier About Their Production Data?
The brand owner should not passively wait for the supplier to offer data. They should actively request it as part of the order confirmation process. Specific, targeted questions elicit the most useful data.
"Based on your production history for this fabric type and this garment complexity, what wastage percentage should we use for the fabric costing?" This question forces the supplier to base the fabric estimate on data, not a generic assumption.
"What was the average number of sample revisions for similar styles in the last twelve months, and what were the primary revision reasons?" This question gives the brand owner a realistic sampling timeline and alerts them to the design details that most often cause delays.
"Can you show me the defect heatmap for a similar style from a previous production run?" This question reveals the likely problem areas and allows the brand owner to adjust the design or the QC plan proactively.
"What was the on-time delivery performance for comparable orders in the last season?" This question provides a data-based probability of the delivery date being met.
A brand owner who asks these questions is demonstrating sophistication. A supplier who answers them readily and with specific data is demonstrating transparency and operational maturity. A supplier who deflects or gives vague answers is revealing a lack of data capability or a lack of transparency.
A brand client asks these questions before every order. He told me, "Your answers are always specific and backed by numbers. That is one of the main reasons I stay with you. I can trust your estimates because I know they are based on real data, not a sales pitch."
How Can "Post-Project Analytics" Help You Refine Your Own Tech Pack Designs?
The post-project analytics report is the data summary provided after the order is complete. It includes the actual fabric consumption, the defect summary, the revision history, and the delivery performance. This report is a goldmine of design intelligence for the brand owner.
The defect summary tells the brand owner which parts of their design are prone to manufacturing issues. If the same seam consistently generates a high defect rate across multiple seasons, the problem may be in the design of the seam, not in the factory's sewing. The brand owner can redesign the seam for the next season.
The revision history tells the brand owner which types of instructions are frequently misunderstood. If the brand owner consistently has to revise the collar shape, the collar specification in the tech pack may be ambiguous. The brand owner can improve the clarity of the collar spec.
The fabric performance data tells the brand owner which fabrics have exceeded or fallen short of expectations. A fabric that pilled badly despite passing lab tests is a fabric to avoid in future seasons. A fabric that exceeded durability expectations is a fabric to reorder.
The brand owner who treats the post-project report as a design feedback loop, not just a shipment confirmation, will produce progressively better tech packs. The tech packs will specify proven details, avoid known problem areas, and use proven materials. The quality will improve, and the sampling cycle will shorten, because the brand owner is learning from the production data, not just from their own design intuition.
A brand owner received a post-project report showing a high defect rate on a specific pocket construction. She redesigned the pocket for the next season, simplifying the corner radius. The defect rate on the new pocket was near zero. The post-project data had directly informed a design improvement.
Conclusion
The garment factory of the future is not just a place where fabric is cut and sewn. It is a place where data is captured, analyzed, and transformed into predictive intelligence. The factory that does this well is not just a manufacturer. It is a risk management partner for the brand owner.
We have walked through the data we capture, from fabric utilization to defect frequency to revision cycles. We have seen how this data reshapes our QC checkpoints, creating adaptive, heatmap-driven inspection plans that concentrate resources on the areas of highest risk. We have seen how time-and-motion SMV data provides the empirical foundation for accurate pricing and fair volume discounts. And we have seen how the brand owner can access and leverage this data to improve their own designs, their own timelines, and their own business decisions.
The brand owner who chooses a data-driven factory is choosing a lower-risk supply chain. The brand owner who ignores the data, and chooses a factory based on price and a verbal promise, is gambling. The data is the difference between an estimate and a prediction. An estimate is a hope. A prediction is based on evidence.
At Shanghai Fumao, our production database is one of our most valuable assets. It represents years of disciplined data capture and analysis. We use it every day to make better decisions for our brand partners. We share it openly because we believe that an informed client is a better partner.
If you are preparing your next order and want to see how our historical production data can de-risk your project, I invite you to contact our Business Director, Elaine. She can arrange a pre-production data review for your specific product category, share a sample post-project analytics report, and discuss how our data-driven approach can improve the accuracy of your timelines, your costs, and your quality outcomes. Reach Elaine at elaine@fumaoclothing.com. Let's base your next order on evidence, not estimates.