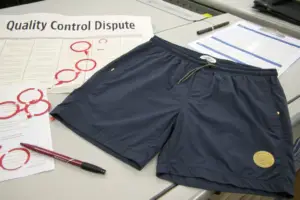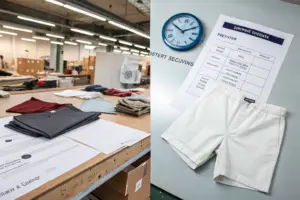

A factory inspection report is a dense, multi-page document filled with numbers, abbreviations, and photographs. For many brand owners, it is a source of confusion rather than clarity. I learned this during a client onboarding call in early 2024. I had sent a client, a new brand owner from Austin, Texas, our standard final inspection report for his first bulk order of 500 canvas work jackets. I was proud of the report. It was comprehensive. It included a full AQL sampling table, inline inspection photos, a tensile strength graph for the main fabric, a color delta report from our spectrophotometer, and a detailed list of every individual defect found, categorized by severity. I expected a brief "Looks good, approved." Instead, I received a panicked phone call. His voice was tight. He said, "You found 12 defects. Does that mean 12 jackets will be returned by my customers? Is this batch a failure?" He had misinterpreted the defect list as a failure notice. In reality, 12 minor defects in a 500-unit inspection under an AQL of 2.5 was a comfortable pass. The report was communicating success, but he was reading failure. I spent an hour teaching him how to interpret the data. After the call, he said something I will never forget: "I've been ordering garments for three years, and no factory has ever taught me how to read their report. I've just been guessing." That call changed our approach to inspection reporting forever.
A Fumao Clothing inspection report is read correctly by first checking the AQL sample size and acceptance limits, then reviewing the defect classification table to understand the severity of each finding, and finally examining the instrumental data for fabric and color performance; a pass/fail judgment is based on the total defect count against the AQL limit, not on the raw presence of defects.
The fundamental misunderstanding that trip most brand owners is the assumption that a defect-free report is realistic or even honest. A zero-defect report from a factory is a red flag, not a green one. Garment manufacturing is a manual process. A sewing operator makes thousands of stitches per hour. A cutting machine handles hundreds of fabric plies. Variation is inherent. Defects happen. An honest factory finds them, records them, and uses the data to control the process. A dishonest factory hides them and ships a clean report that does not reflect the physical product. The true quality signal in an inspection report is not the absence of defects. It is the factory's demonstrable ability to find, classify, and contain them within statistically acceptable limits. Our reports contain more data than most because our inspection system is designed to be a transparent control tool for our clients, not a marketing document. Reading it correctly unlocks a deep, quantitative understanding of the batch quality without needing to visit the factory. This guide explains how to interpret each section.
What is the AQL Table’s Real Meaning for Your Order?
The AQL table is the statistical foundation of the entire inspection report. AQL stands for Acceptable Quality Level. It is a sampling methodology, defined in ISO 2859-1, that determines how many units from a batch must be randomly inspected, and what the maximum number of acceptable defects is, given a specific batch size and a chosen AQL level. The brand owner does not inspect 5,000 garments one by one. The inspector pulls a statistically determined random sample, inspects it thoroughly, and uses the results to infer the quality level of the entire batch. The sample size is not arbitrary. It is calculated from the batch size using the AQL table's sample size code letters. A batch of 500 units corresponds to a sample size code letter of J, which requires a sample size of 80 units for a normal inspection level. This is fixed by the standard.
The AQL table encodes the exact number of randomly selected units to be inspected, the maximum number of permissible defects for each severity class, and the statistical confidence level that the batch quality falls within the agreed standard; understanding this table transforms a subjective quality judgment into an objective, pass/fail decision based on global standards.
How Do We Determine the Sample Size for a 500-Unit Order?
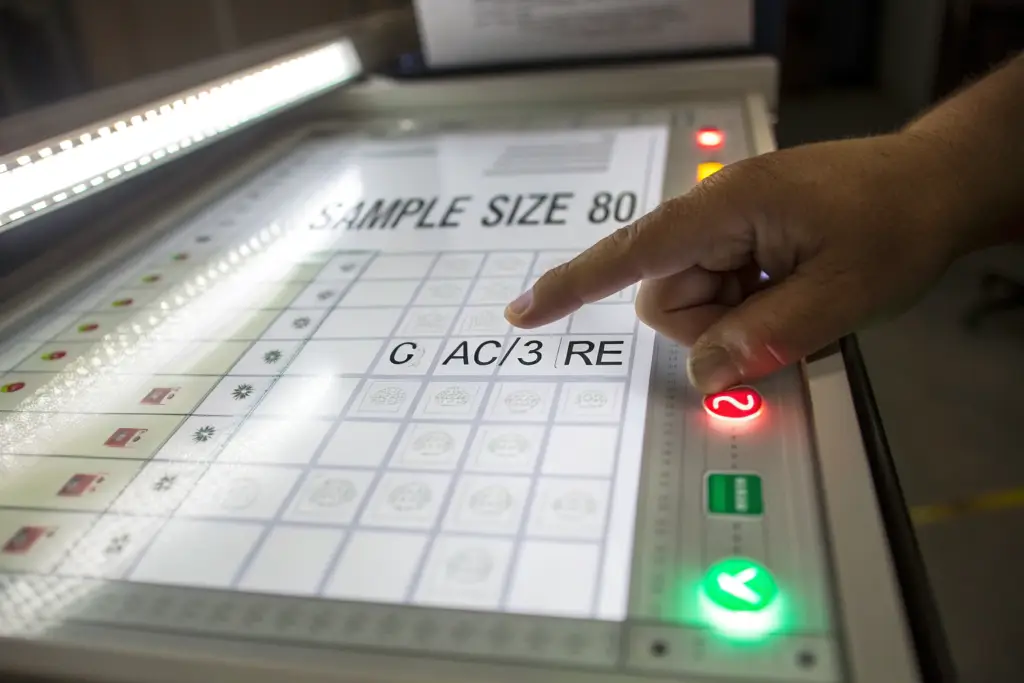
The sample size is not a guess. It is a direct function of the batch size and the inspection level. We default to General Inspection Level II, which is the international standard for apparel. The batch size, the total number of units in the order, is entered into the table. The table returns a code letter. For a batch of 500 units, the code letter is J. The code letter is then cross-referenced with the inspection level to determine the sample size. For code letter J, the sample size is 80 units. This means our inspector will randomly pull 80 jackets from the 500-unit batch for detailed inspection. The selection is genuinely random, using a random number generator to pick carton numbers and positions within the carton.
The brand owner does not need to memorize the code letters. The report specifies the batch size, the sample size code letter, and the sample size in the header of the AQL table. The critical number to verify is that the sample size matches the batch size according to the standard. If a factory inspects 20 units from a 500-unit batch and claims an AQL 2.5 pass, that is statistically invalid. The sample size is too small to provide the specified confidence level. Our report includes the ISO 2859-1 table reference so the client can independently verify the sample size. This transparency is intentional. It eliminates the possibility of a factory manipulating the sample size to make a defective batch appear acceptable. We want our clients to understand the statistical logic, not just trust our conclusion. This is an integral part of our manufacturing compliance protocols.
What is the Difference Between "2 Ac / 3 Re" at AQL 2.5?
The notation "2 Ac / 3 Re" is the decision rule at the heart of the AQL system. "Ac" stands for Accept. "Re" stands for Reject. For a sample size of 80 units at an AQL of 2.5 for major defects, the acceptance number is 2, and the rejection number is 3. This means if the inspector finds 2 or fewer major defects in the 80-unit sample, the batch is accepted. If the inspector finds 3 or more major defects, the batch is rejected. The numbers are absolute thresholds. There is no "close to failing." A batch with 2 major defects is a pass. A batch with 3 major defects is a fail. The standard is unambiguous.
The key nuance is that AQL levels are different for different defect severity classes. We use a three-class system aligned with industry standards. For critical defects, defects that pose a safety hazard or render the product unsaleable such as a sharp needle fragment or a broken zipper that cannot be opened, the AQL is 0. A single critical defect in the sample triggers immediate batch rejection. For major defects, defects that significantly reduce the product's saleability such as a visible stain on the chest or a seam with slippage exceeding 3mm, the AQL is typically 2.5. For minor defects, issues that are slight deviations from specification but do not significantly affect saleability such as a slightly uneven stitch line or a loose thread that does not unravel, the AQL is typically 4.0. The sample size is the same across all three classes, but the acceptance numbers differ. The report has a separate table row for each severity class. The brand owner's first task when reading the report is to locate the total defect count for each severity class and compare it to the acceptance number on that row. If all three defect counts are at or below the acceptance number, the batch passes. If any one class exceeds its rejection number, the entire batch fails. This multi-class approach prevents a factory from averaging a critical safety defect with a bunch of minor loose threads and claiming an overall pass. We cannot hide a critical failure inside a statistically acceptable minor defect rate.
How to Decode the Defect Classification Matrix?
The defect list is the most emotionally charged section of the report. A list of 15 defects looks alarming. The correct response is not alarm. It is classification. Not all defects are equal. A missing button is a major defect. An uncut thread tail is a minor defect. A contaminated needle puncture is a critical defect. Their business impact varies from zero to a potential lawsuit. The defect classification matrix is the intellectual framework for assigning each observed flaw to its correct severity class. A brand owner who can read this matrix can see past the raw count to the actual quality risk profile of the batch. Twelve minor loose thread defects and zero major defects is a clean batch, regardless of the raw number 12. One critical safety defect and zero minor defects is a catastrophic batch. The raw count is meaningless without the classification.
The defect classification matrix categorizes every flaw by its impact on customer safety, product saleability, and functional usability, ensuring that a batch with many minor cosmetic issues is not conflated with a batch containing a single, dangerous safety failure.
What Elevates a Loose Thread to a "Major" Defect?
A loose thread is the most common finding in any garment inspection. Ninety-five percent of loose threads are minor defects. They are a snipped thread tail that the finishing operator missed, typically less than 5mm long, not attached to a running seam, and posing no unraveling risk. A minor loose thread is a cosmetic imperfection. It takes a QC operator two seconds to trim with scissors. It costs nothing. It will never be noticed by a customer. However, a loose thread becomes a major defect under specific conditions that we train our inspectors to identify.
A loose thread is classified as major if it is a chain stitch tail from a hem or a waistband seam that, if pulled, will cause the entire seam to unravel. This is identifiable because the thread tail forms a continuous loop back into a running stitch line. Pulling it is like pulling a drawstring; the entire seam collapses. Another major classification is a loose thread inside a buttonhole that prevents the button from passing through cleanly, rendering the garment functionally unwearable. A third major classification is a loose thread that is visibly a different color from the garment, indicating the sewing operator inserted a wrong color bobbin and the thread "tail" is actually a section of incorrect stitching that was cut out but still partially visible. The inspector is trained to pull gently on every loose thread observed. If resistance is felt and the seam geometry begins to distort, the thread is classified as major. If the thread pulls free cleanly with no distortion, it is classified as minor. This simple pull-test protocol differentiates a cosmetic issue from a structural failure. The inspection report's defect description column includes a note indicating whether the pull test was performed and the result. The brand owner can see the evidence base for the classification decision, not just the final label. This is a key differentiator in our quality assurance documentation.
Why Are Color Continuity Issues Scored Against a Delta E?
Fabric color is not inspected by human eye in our system. Human color perception is subjective, fatigueable, and influenced by ambient lighting. Two people looking at the same navy jacket under warm fluorescent lights will disagree on whether the color matches the approved standard. This subjectivity is unacceptable for a premium brand where color consistency across a collection is a core part of the brand identity. We use a spectrophotometer, a calibrated instrument that measures the exact spectral reflectance of a surface, and report the color difference as a Delta E value. Delta E is a single number that represents the mathematical distance between the measured color and the target color in a three-dimensional color space. A Delta E of 0 is a perfect match. A Delta E of 1.0 is a just-perceptible difference to a trained eye. A Delta E of 2.0 is a visible difference to an untrained eye under good lighting.
Our internal standard for bulk production color acceptance is a Delta E of less than 1.5 for the main body fabric when compared to the approved lab dip or the physical color standard. For trims like zipper tapes and buttons, where a slight contrast can be intentional and aesthetically pleasing, the tolerance is wider at 2.5. The inspection report includes a color measurement table for each colorway in the batch. The table lists the target a and b values from the approved standard, the measured a and b values from the random sample, and the calculated Delta E. Any Delta E value above the tolerance is automatically flagged as a major defect, regardless of the inspector's personal opinion. This instrument-based color scoring removes the single largest source of post-shipment color disputes between brands and factories. A brand owner who reads the Delta E table can see exactly how much the bulk fabric deviates from the standard, expressed as a single, legally defensible number. There is no room for an email argument about whether the navy is "too purple." The spectrophotometer says the Delta E is 1.2, which is within spec. The conversation is over. This is how we use metrology to resolve subjective disagreements.
How Does Inline Inspection Data Predict the Final Result?
A final inspection report is a historical document. It tells you the quality level of the batch after it is packed and ready to ship. At that point, corrective action is expensive. Reworking a packed batch, re-inspecting it, and re-packing it adds cost and delay. The brand owner who only sees the final report is making a retrospective judgment on a completed event. Inline inspection data is different. It is a predictive, forward-looking indicator. It tells the production team and the brand owner, during the sewing process, where the defects are originating, which operators need re-training, and whether the batch is on track to pass the final inspection. Our inline inspection system generates data continuously throughout the production run, typically at 20 percent, 50 percent, and 80 percent completion checkpoints.
Inline inspection data, collected at production checkpoints rather than at the end, predicts the final pass/fail outcome with a high degree of confidence by tracking the defect rate trend, identifying systemic issues early, and allowing real-time process corrections that prevent a cascade of repeated defects through the remaining batch.

How Do We Use the 20% Check to Correct the Remaining 80%?
The 20 percent inline check is our most powerful quality leverage point. When the first 100 units of a 500-unit order come off the sewing line, our inline QC inspector pulls a random sample and performs a full inspection, identical in methodology to the final inspection but on a smaller scale. The purpose is not to pass or fail the batch. It is to identify the dominant defect modes and feed that information back to the production supervisor immediately. The inspector generates a Pareto chart, a bar chart that ranks defect types by frequency. If the Pareto chart shows that five out of eight defects found are "uneven topstitch width on left cuff," a single, specific, and correctable problem is identified. The inspector immediately notifies the sewing line supervisor. The supervisor pauses the line for the specific operator, re-calibrates the folder guide on their machine, provides a five-minute re-training demonstration, and re-starts the line. The remaining 400 units will be sewn with a corrected topstitch.
This feedback loop takes under 30 minutes from defect detection to process correction. Without it, the production line would run all 500 units with the same incorrect topstitch. The final inspection would find 25 uneven cuffs. The batch would potentially fail the AQL major defect limit. The entire batch would require rework or rejection. The 20 percent inline check prevented a final inspection failure by catching the problem at its source when only 20 percent of the units were affected. The brand owner who receives our final report also sees the inline Pareto charts and a summary of the corrective actions taken. They can see not just that the batch passed, but also that a specific problem was detected early, a specific corrective action was implemented, and the defect frequency dropped to zero in the subsequent inline checkpoints. This narrative of active problem-solving is far more valuable to a brand owner's peace of mind than a simple "passed" stamp.
What Trend Data Confirms a Stable Production Line?
A single inspection data point is a snapshot. A trend line is a story. A trend line that shows the defect rate decreasing from the 20 percent checkpoint to the 50 percent checkpoint to the final inspection tells the story of a production line that is under control, learning, and improving. A trend line that shows a flat defect rate tells the story of a process that is stable but not improving. A trend line that shows a rising defect rate tells the story of a process that is deteriorating, perhaps due to operator fatigue, a batch of defective incoming fabric, or a machine maintenance issue that is worsening over time. The trend is more diagnostically useful than any single data point.
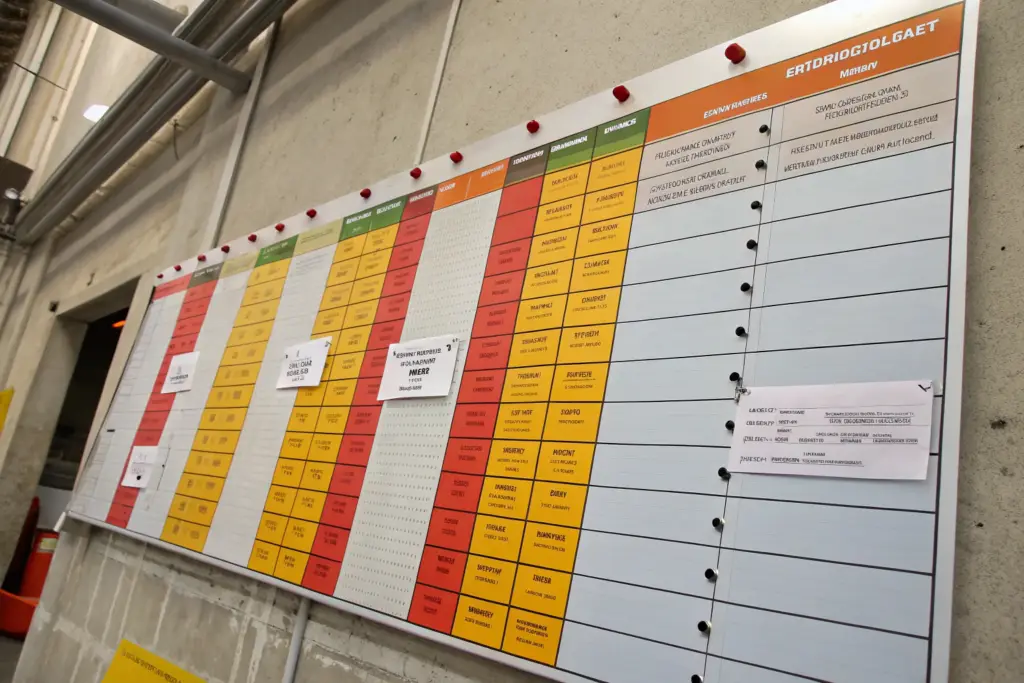
We track three key metrics on an inline trend chart. The first is the total defects per hundred units, or DHU, which is the overall defect density independent of severity. The second is the major defect percentage, which is the proportion of total defects classified as major. The third is operator-specific defect rate, which tracks which individual sewing operators are generating the most defects. This third metric is crucial for accountability. If operator 14 consistently shows a higher defect rate than the line average, the production supervisor can provide targeted coaching. The brand owner receives this trend data in the inline section of the report. The data is presented as a simple line graph with each checkpoint on the x-axis and the DHU on the y-axis, with a horizontal red line indicating the maximum DHU that would trigger a final inspection failure. If the trend line is well below the red line and trending downward, the brand owner can visually confirm that the production line is healthy and the final outcome is statistically predictable. This trend visibility is a core component of our product development and manufacturing transparency.
Conclusion
Reading an inspection report correctly is a skill that transforms the brand owner from a passive recipient of a supplier's quality verdict into an active, informed participant in the quality assurance process. The report is not a mystery to be accepted on faith. It is a structured, evidence-based argument that the shipped batch conforms to the agreed specification within statistically defined limits. The AQL table teaches the brand owner that quality is never absolute zero; it is a managed, measured, and statistically bounded tolerance. The defect classification matrix teaches that a count of defects is meaningless without the classification of their severity; one critical defect outweighs a hundred minor ones. The inline inspection data teaches that quality is not a final gate inspection but a continuous, predictive feedback loop that catches and corrects problems when they are small and containable. The instrumental data teaches that subjective attributes like color and fabric strength can be, and must be, reduced to objective, instrument-read numbers that leave no room for post-shipment dispute.
The brand owner who understands these three sections no longer panics at a defect list. They scan the AQL acceptance numbers. They check the severity classification of each defect. They examine the inline trend to see if the process was stable. They check the Delta E table to confirm the color is within tolerance. They then make a calm, data-driven decision. Approve, rework, or reject. The decision is theirs, based on evidence they have been trained to interpret. This is the ultimate goal of our transparent reporting methodology. We do not want clients who blindly trust our "passed" stamp. We want clients who understand our data, question our findings, and collaborate with us to improve the process.
If you are holding a factory inspection report right now and feel more confusion than clarity, or if you are developing a new quality assurance protocol for your brand and want to build your specification around a truly transparent reporting standard, we have prepared a comprehensive guide that walks through a fully annotated sample report, section by section, explaining every data field. To receive a copy of the Fumao Clothing Inspection Report Reading Guide, and to schedule a 30-minute walkthrough of your own inspection data with our QC manager, contact our Business Director, Elaine, at elaine@fumaoclothing.com. Let us help you build the skill of reading your product's quality story.