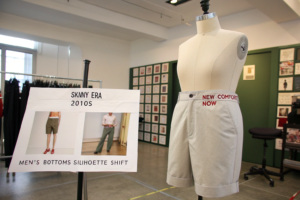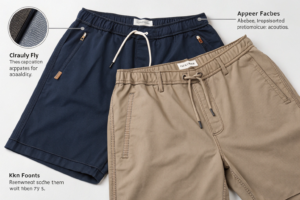
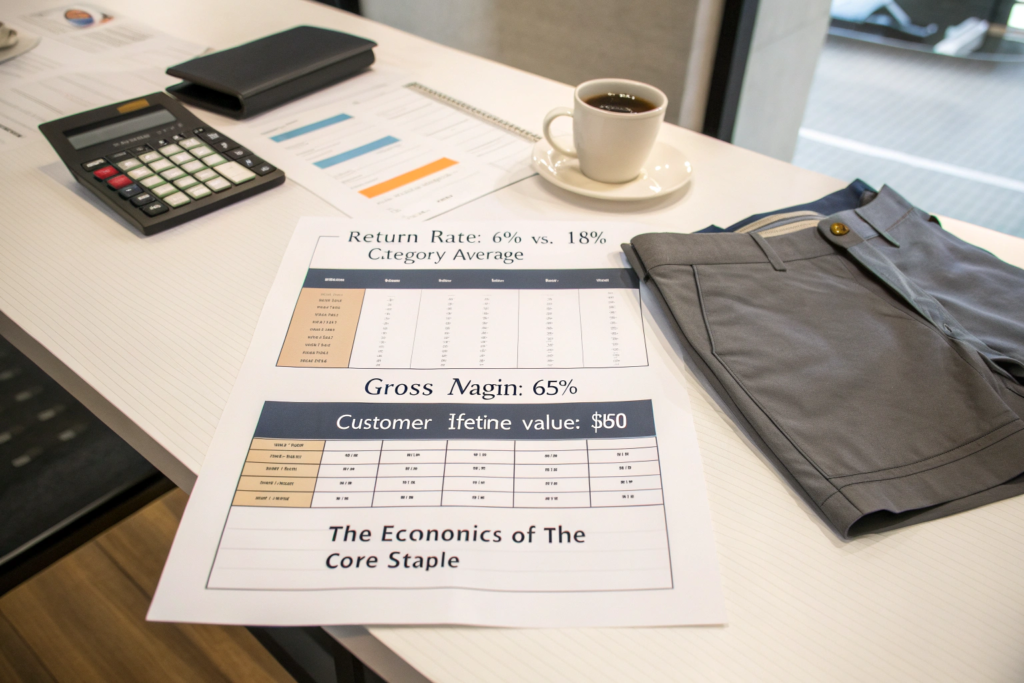
A few years ago, I sat across a table from the co-founder of a menswear brand. She was the creative force, the one with the eye for proportion, fabric, and silhouette. Her business partner was a former management consultant, a numbers-driven operator who viewed the brand's product line as a portfolio of SKUs to be optimized for margin and turnover. The creative founder had been trying to convince him to invest more in their classic shorts line. He was resisting. "The margins are good," he said, "but they are just basic shorts. There is no differentiation. Why should we put more resources into a commodity?" She had tried to explain the value in aesthetic terms, the way the waistband sat, the way the fabric draped, the way the customer looked when they wore them. He did not understand that language. She asked me to try a different approach.
Explaining the value of classic shorts to a data-driven business partner requires abandoning the language of aesthetics, design, and subjective quality, and instead translating every design feature and every customer experience into the hard numbers that a data-driven mind respects: the lower return rate, which is not about fit but about predictable cash flow and reduced reverse logistics cost; the higher repeat purchase rate, which is not about brand loyalty but about a measurable increase in Customer Lifetime Value; and the resilience to markdown pressure, which is not about timeless style but about a higher and more reliable Gross Margin Return on Inventory Investment.
At Shanghai Fumao, I have had this conversation with many business partners who do not speak the language of aesthetics. They do not need to. The value of a well-made classic short is quantifiable, provable, and compelling in purely financial terms. Let me walk you through the numbers.
How Do You Translate a Low Return Rate into Financial Language?
The data-driven business partner cares about margins, costs, and predictability. The return rate is a number that directly impacts all three. A poorly made pair of classic shorts has a return rate that can exceed 15%. A well-made pair has a return rate that can be held below 8%. This difference is not just a customer satisfaction issue. It is a direct, calculable impact on the bottom line.
A low return rate is a direct financial advantage that translates into a lower cost of reverse logistics, a reduced incidence of chargeback fees from credit card processors, a higher percentage of inventory sold at full price rather than written off as unsaleable returns, and a more predictable cash flow that is essential for a growing business, with a difference of 10 percentage points in the return rate, between a poorly made short and a well-made short, often representing a swing of 8% to 12% in the net margin per unit sold.
What Are the Specific Line Items That a Return Erodes?
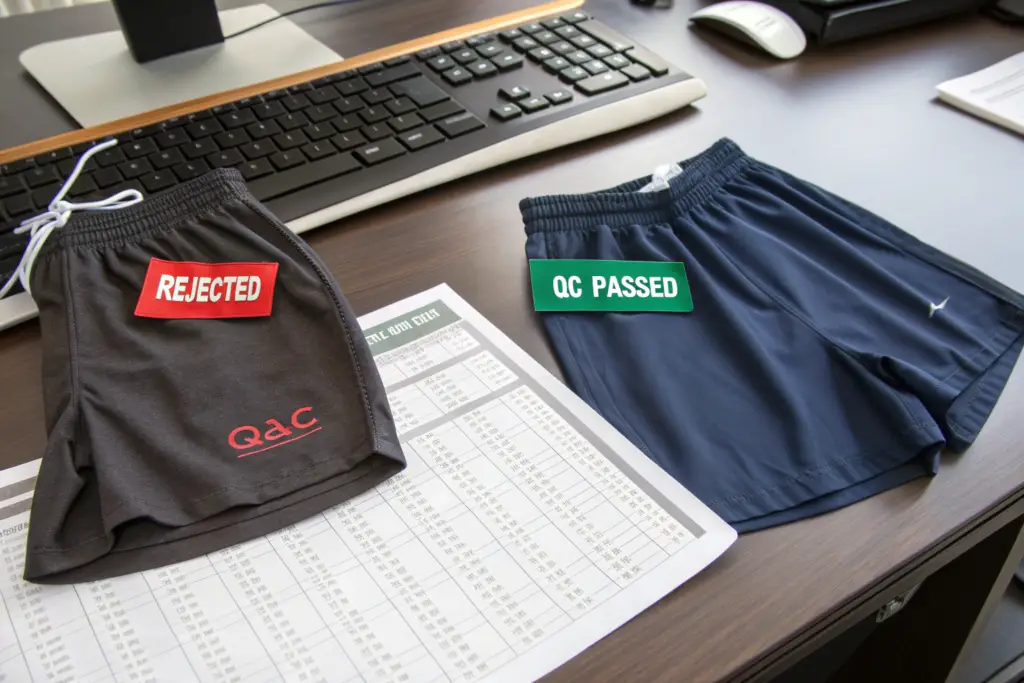
When a customer returns a pair of shorts, the cost to the business is not just the refund of the purchase price. The business loses the outbound shipping cost, which was not charged to the customer if free shipping was offered. The business pays for the return shipping label. The warehouse team spends time receiving, inspecting, and processing the return. If the shorts are damaged or show signs of wear, they cannot be restocked and must be written off entirely.
If the customer disputes the charge with their credit card company, the business pays a chargeback fee of $15 to $25 per transaction, win or lose. If the chargeback rate exceeds a threshold, typically 1% of transactions, the payment processor may increase the business's processing fees or terminate the account. Each of these costs is a specific line item that the data-driven business partner can calculate. A lower return rate directly reduces each of these costs. This e-commerce returns cost analysis provides the framework for calculating the true cost of returns.
How Does a Low Return Rate Translate to Predictable Cash Flow?
The data-driven business partner values predictability. A business that can forecast its cash flow accurately can make better decisions about inventory purchasing, marketing spend, and hiring. A high return rate introduces uncertainty. The business books the revenue when the order is placed, but a percentage of that revenue will be reversed weeks or months later when the customer returns the product. The business cannot be sure of its true revenue position.
A low return rate reduces this uncertainty. The revenue that is booked is more likely to be final revenue. The cash that is received is more likely to stay in the bank account. This predictability is valuable to a data-driven operator. It is a direct financial benefit of a well-made, well-fitting classic short. This return rate and cash flow forecasting explains the connection between returns and financial predictability.
How Do You Prove Repeat Purchase Rate Is Tied to Construction Quality?
The data-driven business partner understands the concept of Customer Lifetime Value. Acquiring a new customer costs money, often more money than the profit from the first purchase. The business only becomes profitable on a customer if that customer buys again. The repeat purchase rate is the key to LTV. A poorly made classic short, one that shrinks, fades, or loses its shape after a few washes, generates a one-time sale. A well-made classic short generates a loyal, repeating customer.
Repeat purchase rate is a direct function of garment durability and fit consistency, with a well-constructed classic short made from pre-shrunk, colorfast fabric generating measurably higher repurchase rates than a poorly constructed short that degrades after washing, a difference that can be isolated through cohort analysis, where the group of customers who purchased the well-made short consistently shows a higher retention rate and a higher number of repeat purchases over a 12 to 24-month period compared to the cohort that purchased a lower-quality version.
What Is a Cohort Analysis and How Does It Prove Quality Drives Loyalty?
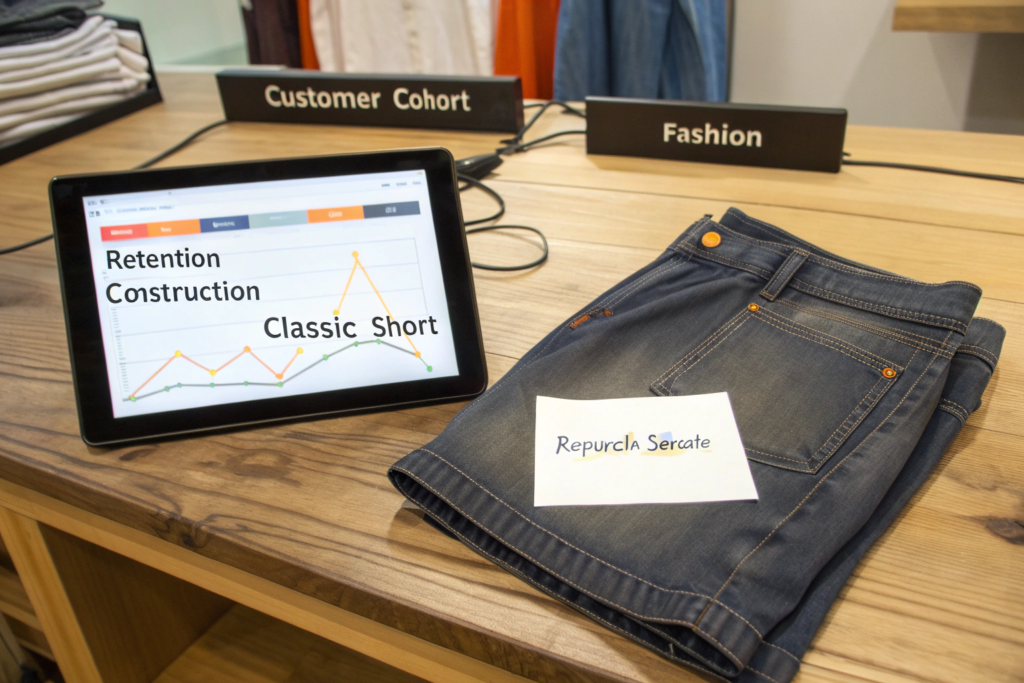
A cohort analysis is a method of grouping customers based on a shared characteristic, often the date of their first purchase or the specific product they purchased, and tracking their behavior over time. The data-driven business partner is familiar with this analytical technique.
The brand can run a cohort analysis comparing two groups of customers. Cohort A purchased the well-made classic short from the premium factory. Cohort B purchased a similar-looking classic short from a lower-cost factory. The analysis tracks the repurchase rate, the average number of orders, and the total lifetime value for each cohort over the following 18 months. If the well-made short genuinely delivers better customer satisfaction, Cohort A will show a measurably higher repurchase rate and a higher LTV. The data proves the point. This cohort analysis for e-commerce customer retention explains the methodology.
How Does Consistent Fit Across Colorways Contribute to Repeat Purchase?
A common reason for returning a second purchase of a "favorite" short is inconsistent fit. The customer buys the navy short, and it fits perfectly. Encouraged by the experience, they order the same short in khaki. The khaki pair fits slightly smaller or tighter because the fabric dye lot shrank differently. The customer is frustrated, returns the shorts, and loses trust in the brand. The repeat purchase cycle is broken.
A well-made classic short addresses this by using fabric that is tested for shrinkage before cutting, and by adjusting the pattern for each dye lot if necessary. The navy and the khaki fit identically. The customer's repeat purchase experience is seamless. This consistency builds trust, and trust drives repeat purchases. This specific data point, the return rate by colorway, is often a powerful argument for the data-driven partner. It demonstrates an attention to detail that directly impacts the numbers. This size and fit consistency in apparel manufacturing explains the processes involved.
How Do You Present the "Anti-Markdown" Margin Protection in Spreadsheet Terms?
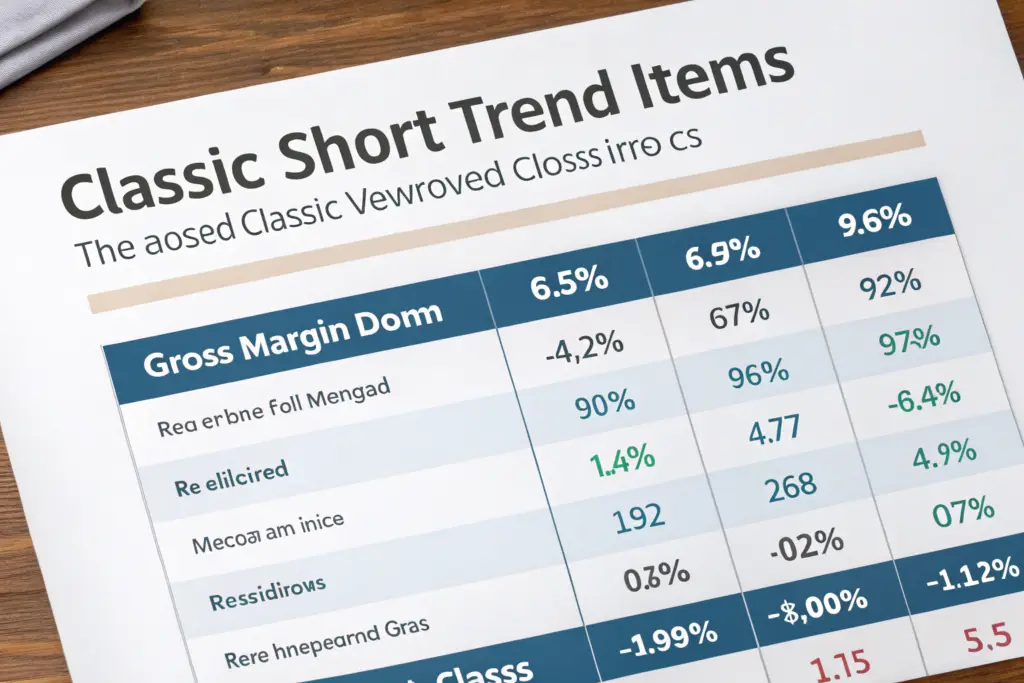
The data-driven business partner cares deeply about margin. They understand that the margin planned at the beginning of the season is not the margin that will be realized if the product must be discounted. The fashion item, the printed short or the trendy silhouette, carries a high markdown risk. The classic short, the khaki, the navy, and the stone, carries virtually no markdown risk. This difference can be presented in the stark, clear language of a spreadsheet.
The classic short provides "Anti-Markdown" margin protection because its demand is non-seasonal and trend-independent, meaning that a unit of inventory that does not sell this month will sell next month or next season at the same full price, a financial characteristic that can be modeled in a spreadsheet as a "Gross Margin at Full Price vs. Realized Gross Margin After Markdowns" comparison, with the classic short consistently achieving a Realized Gross Margin that is 95% to 100% of the Planned Gross Margin, while the trend item often achieves only 50% to 70% of the Planned Gross Margin after end-of-season clearance discounts are applied.
How Do You Model the Gross Margin Return on Inventory Investment?
The Gross Margin Return on Inventory Investment is a powerful metric that combines margin and turnover into a single number. It is calculated by dividing the Gross Margin generated by the product by the Average Inventory Cost. It measures how much gross margin profit is generated for every dollar invested in inventory.
A classic short may have a slightly lower initial planned margin than a higher-priced fashion item. But because the classic short sells through at full price, without markdowns, and with a faster, more predictable turnover, its GMROI is often significantly higher. The spreadsheet can model this. The fashion item generates $65 in planned margin on a $25 inventory investment, a 260% planned return, but the realized return after markdowns drops to 150%. The classic short generates $45 in planned margin on a $20 inventory investment, a 225% planned return, and achieves 220% realized. The classic short delivers a higher, more reliable return on the cash invested in inventory. This Gross Margin Return on Inventory Investment analysis explains the metric in detail.
Why Does the "Never on Sale" Price Integrity Protect the Brand's Data?
The data-driven business partner may also be responsible for the brand's positioning and its relationship with wholesale accounts. A brand that consistently marks down its products trains its customers to wait for the sale. The customer who bought a short at full price in May, and then sees the same short discounted by 40% in August, feels cheated. They are less likely to pay full price in the future. The brand's pricing power is eroded.
The classic short, which sells through at full price without markdowns, protects the brand's price integrity. The data is clear. The full-price sell-through rate is high. The discount rate is near zero. The brand is not training its customers to wait. It is building a reputation for fair, consistent value. This pricing integrity is a long-term asset that protects the brand's margins and its data-driven metrics. This price integrity and brand positioning in retail explains the strategic importance of avoiding unnecessary discounting.
Conclusion
Explaining the value of classic shorts to a data-driven business partner does not require a single aesthetic argument. It requires translating the product's design and construction quality into the language the partner already speaks: the language of numbers, margins, risk, and cash flow. The lower return rate is not just about a happy customer. It is about a lower cost of reverse logistics, fewer chargebacks, and more predictable cash flow. The higher repeat purchase rate is not just about brand love. It is about a measurable increase in Customer Lifetime Value, provable through cohort analysis. The resilience to markdown pressure is not just about timeless style. It is about a higher, more reliable Gross Margin Return on Inventory Investment.
The data-driven business partner who is presented with these arguments, supported by the specific, calculable numbers, will understand the value of the classic short. They may not feel the value, but they will see it. And in a business partnership, seeing the value is enough.
At Shanghai Fumao, I understand that the quality of a classic short is measurable, not just subjective. I provide my brand partners with the data, the specifications, and the quality consistency that support the financial arguments. If you need to make the case for classic shorts to a numbers-driven partner, contact our Business Director, Elaine, at elaine@fumaoclothing.com. Let's give them the numbers they need to see the value.