
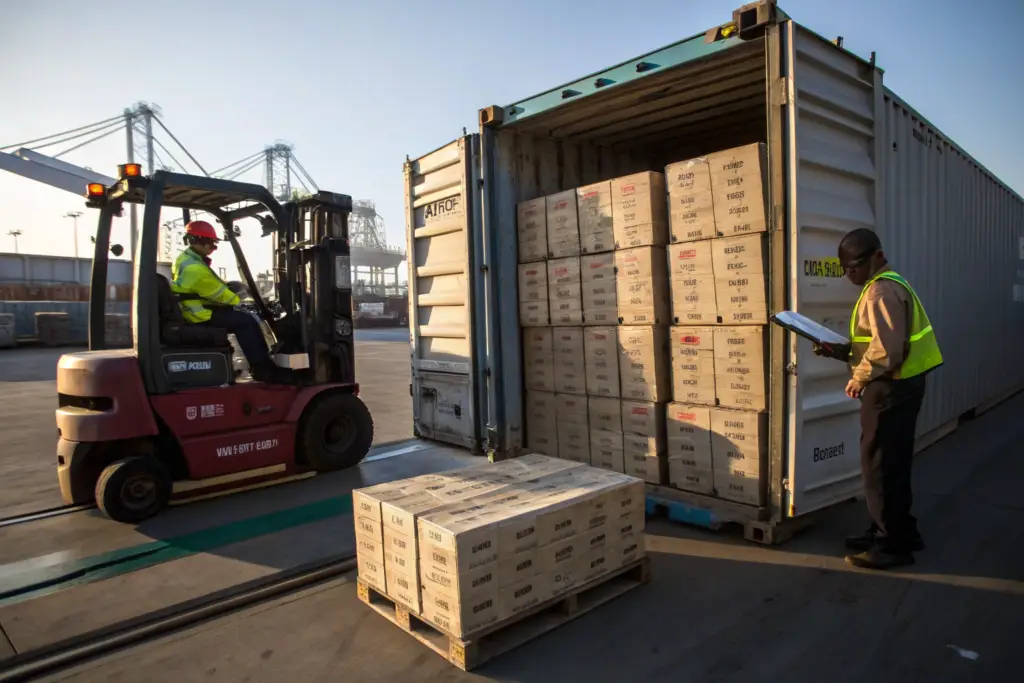
I once watched a first-time brand owner make a $14,000 mistake in about 90 seconds. He was standing in our Shanghai showroom, holding a sample of a beautifully constructed linen blazer. He asked for the FOB price. I told him $22.50 per unit. He pulled out his phone, opened the calculator app, and divided $22.50 by his target retail price of $88. He looked up and smiled. "That is a 74% margin. Let's do 500 units." I did not smile back. I asked him if he knew what the duty rate was for linen blazers imported into the United States. He did not. I asked him if he had factored in the freight forwarder's destination charges at the Port of Los Angeles. He had not. I asked him if his warehouse charged a receiving fee per carton. Blank stare. We sat down and built his actual landed cost together. The real number was $31.80 per unit. His margin was not 74%. It was 64%. Still healthy. But if he had ordered 500 units believing the $22.50 number, he would have underpriced his wholesale, overpaid his sales reps on commission, and wondered why his bank account was empty at the end of the season.
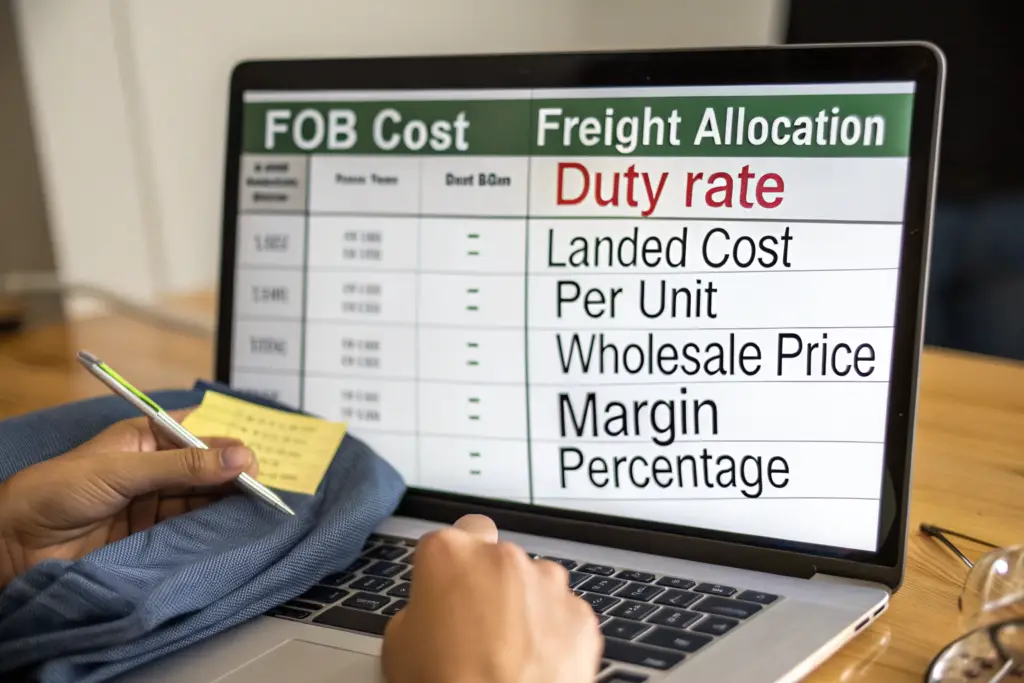
Professional wholesale clothing buyers calculate their landed costs first because the FOB price is a deceptive fraction of the true cost of getting a garment onto a retail shelf. The landed cost includes the FOB price, ocean or air freight, cargo insurance, customs duties, customs brokerage fees, port handling charges, inland trucking, warehouse receiving fees, and often the cost of compliance testing and labeling modifications. Ignoring these costs is like pricing a restaurant meal by the cost of raw ingredients and forgetting the rent, the chef's salary, and the dishwasher's wages. Professional buyers know that only the landed cost reveals the real margin, and only the real margin reveals whether a product is actually profitable.
This principle is so fundamental that I now start every new brand relationship with a landed cost conversation. Before we discuss fabric quality, minimum order quantities, or production timelines, we build a cost model. It sets the financial foundation for every decision that follows. I want to walk you through exactly how professional buyers calculate this number, why each component matters, and how you can use this knowledge to make sourcing decisions that keep your brand solvent and growing.
What Hidden Costs Transform an FOB Price into the True Landed Cost of Imported Apparel?
An FOB price is a clean number. A supplier quotes $15 per unit. The brand does some quick math. It feels concrete. It is not. The journey from a factory in Shanghai to a warehouse in Dallas has at least eight cost events that the FOB price does not cover. Each event adds a layer to the true cost. Some of these costs are predictable. Some fluctuate weekly based on global shipping markets. Some are specific to the port of entry and the type of goods. A professional buyer knows all of them. An amateur buyer discovers them on the invoice.
The hidden costs that transform an FOB price into the true landed cost include ocean freight, which can swing from $2,000 to $20,000 per container depending on global demand. They include customs duties, which range from 0% to 32% depending on the garment type and fiber content under the Harmonized Tariff Schedule. They include customs bonds, merchandise processing fees, harbor maintenance fees, and customs brokerage fees. They include port handling charges, chassis usage fees, pier pass fees, and demurrage if the container is not picked up quickly. They include inland trucking from the port to the warehouse. They include the warehouse receiving fee, which is charged per carton or per pallet. They include the cost of relabeling if the care labels do not meet U.S. requirements. None of these costs appear in the FOB quote.
I built a cost calculator for our brand partners that I update every quarter. It is a spreadsheet with 14 line items below the FOB price. Each line item has a formula that pulls from current market rates. The ocean freight line updates based on the Shanghai Containerized Freight Index. The duty rate line pulls from the latest Harmonized Tariff Schedule. The trucking cost line has mileage-based rates for major U.S. destination cities. When a brand asks me for a price quote, I give them both numbers. The FOB price and the estimated landed cost to their specific warehouse zip code. The FOB price is what they pay us. The landed cost is what they actually spend.
How Do U.S. Customs Duties Vary by Garment Type and Fiber Content?
Customs duties are the largest single add-on cost after freight, and they vary enormously by garment classification. A men's cotton T-shirt pays a different duty rate than a women's silk blouse. A polyester jacket pays a different rate than a wool coat. The difference between a 8% duty rate and a 28% duty rate on a $15 garment is $3.00 per unit. On a 5,000-unit order, that is a $15,000 swing. Professional buyers know the duty rate for their product category before they source a single sample. They can read the Harmonized Tariff Schedule and find the correct HTS code for their garment. They know that fiber content determines classification. A shirt that is 60% cotton and 40% polyester is classified as a cotton shirt, not a synthetic shirt, because cotton is the chief weight fiber. They know that knit garments and woven garments fall under different chapters of the tariff schedule. A knit cotton T-shirt is under Chapter 61. A woven cotton shirt is under Chapter 62. The duty rates are different. We help our brand partners classify their garments correctly during the sampling stage. We provide the exact fiber content breakdown, the knit or woven construction specification, and the gender and age classification. This information feeds directly into the HTS code determination. An incorrect HTS code on a customs entry is not just a pricing error. It is a compliance violation that can trigger a customs audit, back duties with interest, and penalties.
What Destination Charges Do First-Time Importers Consistently Overlook?
First-time importers know about ocean freight. They see it on the freight forwarder's quote. What they miss are the destination charges that hit after the container arrives at the U.S. port. These charges are billed by the shipping line, the port terminal, and the trucking company. They can add $800 to $1,500 to a single container shipment. The list includes the terminal handling charge, which the port charges for moving the container from the vessel to the truck. It includes the chassis split fee, which the trucking company charges when the container chassis is not available at the same location as the container. It includes the pier pass fee at Los Angeles and Long Beach ports, charged for moving containers during peak hours. It includes the customs exam fee if U.S. Customs selects the container for a random inspection. The inspection itself is paid by the government, but the trucking company charges to move the container to the exam site and back. We provide all brand partners with an import destination charges guide that lists every possible charge by port. The guide is specific to the U.S. West Coast, Gulf Coast, and East Coast ports because the fee structures are different. A container arriving at the Port of New York has different destination charges than a container arriving at the Port of Los Angeles. Professional buyers use this guide to build an accurate landed cost model before they place a purchase order.
Why Is Calculating Landed Cost Essential for Setting a Profitable Wholesale Price Strategy?
A brand owner I work with once set her wholesale prices using a rule of thumb. She took the FOB price, multiplied by three, and called that her wholesale price. For two seasons, she was profitable. Then she introduced a heavy knit sweater with a complex cable pattern. The FOB price was higher because the knitting time was longer. The freight cost was higher because the sweaters were bulkier and fewer units fit in a carton. The duty rate was higher because wool sweaters carry a different tariff than cotton sweaters. Her rule-of-thumb pricing did not account for any of this. She underpriced the sweater by $12 per unit at wholesale. She sold 800 units to boutiques before she realized she was losing $9,600 on a product she thought was a hit. She now calculates landed cost per unit before she even approves a sample.
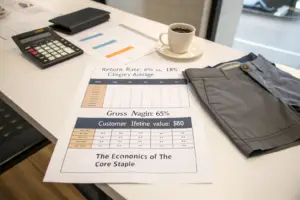
Calculating landed cost is essential for setting a profitable wholesale price strategy because only the landed cost reveals the true cost of goods sold for each unit. Professional buyers use the landed cost to determine their wholesale price using a markup factor that covers their own operating expenses and provides a net profit margin. A typical apparel wholesale markup is 2.2 to 2.5 times the landed cost. If a garment has a landed cost of $20, the wholesale price should be between $44 and $50. This provides the brand with a gross margin of 55% to 60%, which covers design, marketing, sales commissions, overhead, and profit. Pricing from the FOB price instead of the landed cost compresses this margin by the exact amount of the unaccounted import costs.
The wholesale price is a promise to the market. Once you publish it in a line sheet or a trade show catalog, you cannot raise it mid-season. Retail buyers place orders based on that price. If you discover three months later that your actual landed cost is higher than you budgeted, you eat the difference. Your margin shrinks. Your business loses money on every unit sold. This is why professional buyers lock the landed cost first and the wholesale price second. The cost determines the price. Not the other way around.
How Should Freight and Duty Costs Be Allocated Per Unit for Mixed-Carton Shipments?
A shipping container rarely holds a single garment style. It holds a mix of styles, sizes, and colors. A heavy wool coat and a lightweight silk dress in the same container consume different amounts of freight cost. The coat takes up more space and weighs more. Allocating the same freight cost per unit to both garments distorts the true cost of each product. The coat's landed cost is understated. The dress's is overstated. The brand makes pricing decisions based on false data. Professional buyers allocate freight costs by volume, not by unit count. They calculate the cubic meter volume of each garment in its packed carton. They divide the total freight cost by the total cubic meters of the shipment to get a freight cost per cubic meter. They multiply each garment's carton volume by that rate. The heavy coat, which takes up 0.025 cubic meters per unit, gets a higher freight allocation than the silk dress, which takes up 0.012 cubic meters. This freight cost allocation method is standard in logistics accounting, but many small brands do not use it. They divide the total freight bill by the total unit count and call it a day. This lazy math creates pricing errors that compound across a collection. Duty costs require similar precision. The duty rate is applied to the FOB value of each garment, not to an average FOB value across the shipment. A $30 jacket and a $15 shirt in the same container pay different duty amounts. Allocating an average duty cost per unit misstates the true cost of each product.
What Gross Margin Formula Separates Sustainable Apparel Brands from Those That Fail?
A sustainable brand is not defined by its fabric choices. It is defined by its ability to generate enough gross margin to pay its operating expenses, reinvest in product development, and still produce a net profit at the end of the year. The gross margin formula is simple. Gross Margin equals Wholesale Price minus Landed Cost, divided by Wholesale Price. If a brand sells a garment for $50 wholesale and the landed cost is $20, the gross margin is 60%. From that 60%, the brand pays for everything else. Design salaries. Sample development. Marketing. Trade show booth fees. Sales rep commissions. Office rent. Shipping samples to influencers. Returns and chargebacks. Photoshoots. Website hosting. After all of those expenses, the brand needs to have something left over. That is the net profit margin. Most sustainable apparel brands target a net profit margin of 10% to 15%. To achieve that, they need a gross margin of 55% to 65%. The apparel brand financial model is unforgiving. A brand operating on a 45% gross margin has almost no room for error. One delayed shipment, one tariff increase, or one retailer markdown chargeback can wipe out the entire season's profit. We see this in the financial statements of the brands we work with. The brands that consistently hit their net profit targets are the ones that price from an accurate landed cost and maintain a minimum 55% gross margin. The brands that price from FOB and accept whatever margin results are the ones that call us in March asking for extended payment terms because they cannot pay their production invoice.
How Do Fluctuating Freight Rates and Tariffs Threaten Your Sourcing Budget Without Landed Cost Analysis?
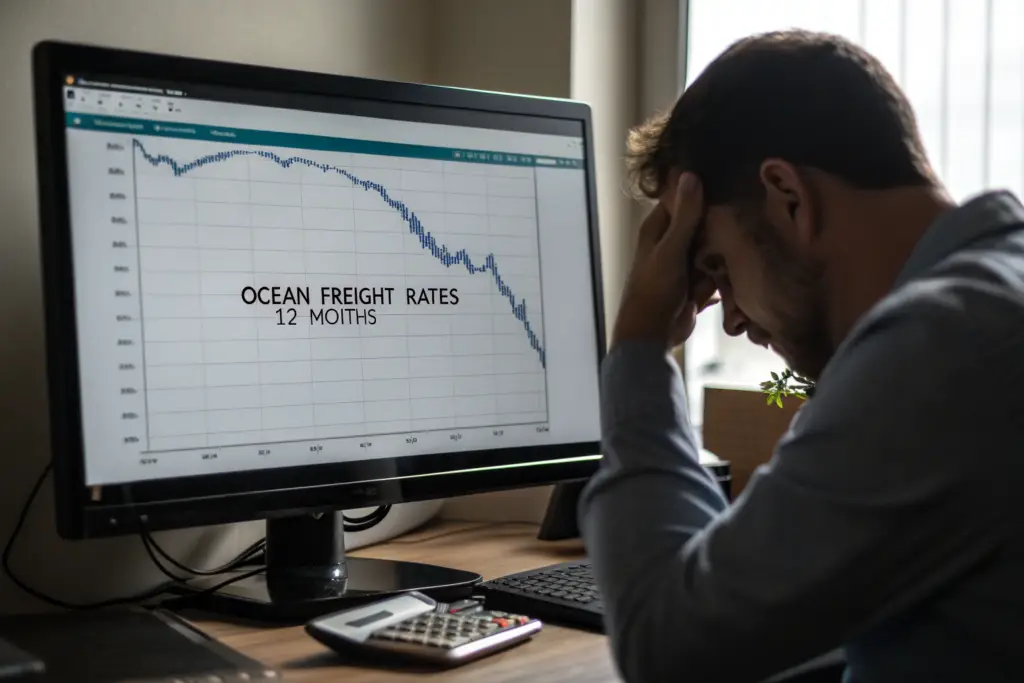
In January 2022, the cost to ship a 40-foot container from Shanghai to Los Angeles was approximately $10,000. In January 2021, that same container cost approximately $4,000. In January 2020, before the pandemic, it cost approximately $1,500. A brand that sourced a garment with an FOB price of $15 in 2020 and assumed a $0.25 per unit freight cost was blindsided in 2022 when the freight cost jumped to $1.67 per unit. On a 6,000-unit order, that was an unplanned $10,000 expense. Brands that calculated landed costs with current freight rates saw the problem coming. Brands that used historical freight rates or ignored freight entirely got a surprise invoice that consumed their entire season's profit.
Fluctuating freight rates and tariffs threaten a sourcing budget because they are large, volatile, and entirely outside the control of the brand or the factory. A landed cost analysis that uses current, verified freight rates and duty percentages reveals the true cost exposure before the purchase order is issued. It also enables scenario planning. A professional buyer calculates the landed cost at the current freight rate, then recalculates it at a rate 30% higher and 30% lower. This range shows the best-case, worst-case, and expected-case margin outcomes. The buyer can then decide whether to proceed, negotiate a price adjustment, or delay the order until freight markets stabilize.
The global shipping market is not stable. It has not been stable since 2020, and there is no reason to believe it will return to pre-2020 predictability. Geopolitical events, port labor negotiations, canal blockages, and fuel price spikes all affect freight rates. A professional buyer treats the freight rate as a variable, not a constant. The landed cost model is updated with every new quote from the freight forwarder. The margin is recalculated. The pricing decision is adjusted if necessary.
How Often Should a Professional Buyer Update Their Landed Cost Model?
The ocean freight market can change significantly in two weeks. A buyer who calculated a landed cost in January using a January freight rate and then issues a purchase order in March without updating the rate is gambling. The professional standard is to update the landed cost model at three trigger points: at the initial sourcing decision, at the purchase order issuance, and at the shipment booking. The initial calculation uses a budget freight rate to determine if the product is viable. The purchase order calculation uses the forwarder's quoted rate for the expected shipping window. The shipment booking calculation uses the actual spot rate on the day the container is booked. If the rate has moved significantly between any of these points, the buyer re-evaluates the margin. Sometimes the margin holds. Sometimes it shrinks to an unacceptable level. In that case, the professional buyer has options. They can negotiate a freight cost split with the factory. They can switch from ocean freight to a freight consolidation service that offers a blended rate. They can adjust the wholesale price if the market allows. They can delay the shipment if the rate spike appears temporary. What they cannot do is ignore the change and hope for the best. Hope is not a financial strategy. We send our brand partners a freight rate update every two weeks during their production cycle. The update shows the current spot rate for their container size on their shipping lane. It also shows the rate trend: rising, falling, or stable. If the rate has moved more than 10% since the last update, we flag it and schedule a call to discuss the margin impact.
What Tariff Engineering Strategies Can Legally Reduce Your Duty Exposure?
Tariff engineering is the practice of legally designing a garment to qualify for a lower duty rate. It is not evasion. It is compliance optimization. The duty rate is determined by the garment's classification under the Harmonized Tariff Schedule. The classification is determined by the garment's fiber content, construction, and sometimes its intended use. A professional buyer knows these classification rules and can make small design adjustments that shift a garment from a higher duty category to a lower one. A jacket with an outer shell of 60% cotton and 40% polyester is classified as a cotton jacket and pays the cotton jacket duty rate. If the shell is changed to 51% polyester and 49% cotton, it becomes a synthetic fiber jacket and pays the synthetic jacket duty rate. The difference can be 10 percentage points. The garment looks and feels nearly identical. The duty savings on a 5,000-unit order can reach $7,500. We work with our brand partners on tariff engineering strategies during the product development stage. We provide fabric content options with their corresponding HTS classifications and duty rates. The brand can see the duty implication of each fiber blend before they finalize the design. This is not about compromising quality. It is about making informed trade-offs. If a 55% linen, 45% cotton blend and a 50% linen, 50% cotton blend produce the same hand feel and the same retail price, but one pays 12% duty and the other pays 0% under a free trade agreement, the choice is obvious. The professional buyer makes that choice consciously, not by default.
What Tools and Systems Do Elite Wholesale Buyers Use to Automate Landed Cost Calculation?
I once watched a buyer for a major U.S. department store work through a cost negotiation. She had a laptop open to a spreadsheet that pulled live data from three sources. Ocean freight spot rates from a logistics API. Duty rates from the U.S. International Trade Commission database. Currency exchange rates from a financial data feed. She entered the FOB price and the carton dimensions. The spreadsheet calculated her landed cost per unit, her gross margin at three wholesale price points, and her projected net profit after her division's operating expenses. The entire calculation took 90 seconds. She did not estimate anything. Every number was current and sourced. That is the standard that professional buyers operate at, and it is the standard that brands competing for retail shelf space must match.
Elite wholesale buyers use automated landed cost calculators that integrate real-time freight rates, duty databases, and currency converters. These tools eliminate manual data entry errors, ensure the calculation uses the most current cost inputs, and allow the buyer to run multiple scenarios in seconds. The best tools also include a historical cost database that allows the buyer to compare the landed cost of a new product against similar products sourced in previous seasons. This benchmarking capability reveals whether a supplier's FOB price, freight rate, or duty classification is an outlier that needs investigation.
The era of calculating landed costs on a napkin at a trade show is over. The apparel industry has compressed lead times, compressed margins, and compressed tolerance for error. A brand that calculates landed costs manually in a static spreadsheet is operating with outdated data. The freight rate they entered last month is already wrong. The duty rate they looked up last season may have changed. The currency exchange rate they used is from a different trading day. Automated tools solve all of these problems by connecting directly to the data sources.

Which Freight Rate APIs and Duty Databases Are Most Reliable for Apparel Importers?
Reliable cost data is the foundation of an accurate landed cost calculation. The best freight rate data comes from digital freight forwarders who publish API-accessible spot rates. These rates are actual bookable prices, not estimates or averages. They reflect the specific shipping lane, container size, and departure window. The Freightos Baltic Index provides weekly container freight rates for major global shipping lanes. It is widely used by logistics professionals as a benchmark. For duty rates, the U.S. International Trade Commission maintains the official Harmonized Tariff Schedule database. It is searchable by HTS code and is updated whenever Congress or the administration modifies duty rates. The database is free and authoritative. For currency exchange rates, the European Central Bank publishes daily reference rates that are used by many financial systems. The rates are updated every business day at around 4 PM Central European Time. Professional buyers set up their cost calculators to pull from these sources automatically. They do not rely on a Google search for "ocean freight rate Shanghai to LA." The Google result might be an ad for a freight broker, a six-month-old blog post, or a rate that applies to a different container size. The professional buyer goes to the primary source.
How Can a Dynamic Landed Cost Dashboard Improve Multi-Season Sourcing Decisions?
A dynamic landed cost dashboard is not just a calculator. It is a memory. It stores the landed cost data for every product the brand has ever sourced. This historical data enables powerful comparative analysis. When a buyer evaluates a new product from a new supplier, they can pull up the landed cost of a similar product from the previous season. They can compare the FOB price component. Is the new supplier quoting significantly higher or lower? They can compare the freight component. Has the shipping lane become more expensive? They can compare the duty component. Has the tariff classification changed? The dashboard also enables what-if scenario modeling. What if the freight rate increases by 20%? What if the U.S. dollar strengthens against the Chinese yuan by 5%? What if the duty rate increases under a new trade policy? The buyer can adjust each variable and see the margin impact instantly. This supply chain analytics capability transforms sourcing from a reactive purchase process into a strategic planning function. A brand we work with uses their dashboard to run a "stress test" on every new product. They calculate the landed cost at the current freight rate, at a 30% higher rate, and at a 50% higher rate. If the product is still profitable at the 50% higher rate, they proceed with confidence. If it breaks even at the 30% higher rate, they negotiate with the supplier or redesign the product. If it loses money at the 30% higher rate, they kill the product before it consumes any development resources. This discipline has saved them from at least three products that would have been profitable in calm markets and disastrous in volatile ones.
Conclusion
The FOB price is a seductive liar. It whispers a margin that does not exist. It hides freight costs in a shipping line's invoice, duty costs in a customs broker's statement, and handling costs in a warehouse's receiving report. Professional wholesale buyers know this. They do not celebrate when they hear a low FOB price. They calculate the landed cost first, and then they decide whether to celebrate. The discipline of landed cost calculation is not a tedious accounting exercise. It is the financial self-defense mechanism that separates brands that thrive from brands that barely survive.
At Shanghai Fumao, we do not want our brand partners to be surprised by any cost after the goods leave our factory. That is why we provide a detailed landed cost estimate with every quote. It includes the FOB price, the estimated ocean freight based on your container utilization, the applicable duty rate under your product's HTS code, and a line-by-line breakdown of destination charges at your port of entry. We update this estimate at three points during the production cycle: at initial quote, at purchase order confirmation, and at shipment booking. If a cost changes, you know about it before it hits your invoice.
If you are ready to work with a factory that treats financial transparency as a core service, not an optional extra, reach out to us. At Shanghai Fumao, we will build your first landed cost model together. Send your product specifications and your delivery zip code to our Business Director, Elaine, at elaine@fumaoclothing.com. She will return a landed cost estimate within 48 hours, along with a freight rate trend report and a duty classification recommendation for your product. Know your numbers before you spend a single dollar on samples. Your margin depends on it.