A San Diego-based contemporary womenswear brand once selected their seasonal collection based entirely on the founder's intuition and a handful of European runway images saved from Pinterest. The founder had great taste—her previous two seasons had been moderate successes. For Fall, she bet heavily on neon color-blocking and oversized puffer silhouettes because she personally loved them. The collection was beautiful. It was also a commercial disaster. By the time it hit wholesale showrooms, the neon trend had faded, replaced by a quiet luxury neutral palette that the founder had dismissed as "boring." The brand sold through at 42% full price and spent the following year digging out of the inventory debt. The founder's intuition had been precisely one season behind the market. Six months later, a competitor brand launched a collection selected using AI trend forecasting that analyzed social media sentiment, search query data, and e-commerce sell-through patterns across 50,000 data points. Their collection aligned with the emerging demand for quiet luxury. They sold through at 88%.
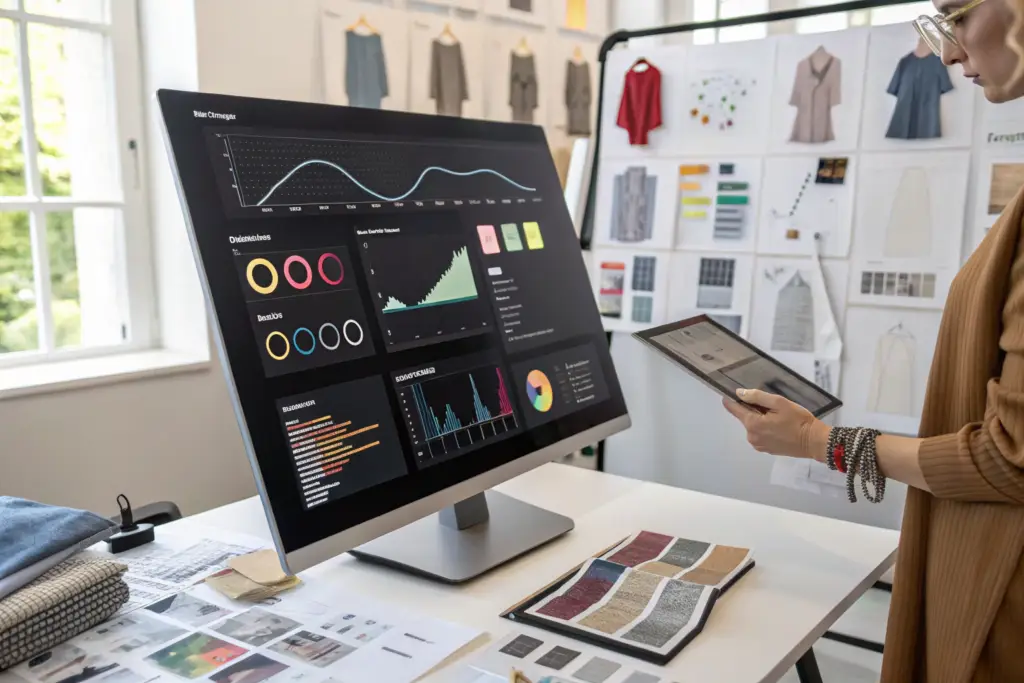
To use advanced AI trend forecasting to select the best wholesale clothing styles, you must integrate three specific data streams into your seasonal line planning: social media sentiment analysis that tracks emerging color, silhouette, and detail mentions across TikTok, Instagram, and Pinterest before they appear on runways; search query trend data from Google Trends and e-commerce platform search analytics that reveals what wholesale buyers and consumers are actively searching for; and competitor sell-through data aggregated from public e-commerce bestseller lists and wholesale platform rankings, all synthesized by an AI forecasting platform such as Heuritech, WGSN TrendCurve, or Edited into a quantitative "Style Probability Score" that predicts the likely commercial performance of each proposed style in your collection before you commit to sampling and production.
At Shanghai Fumao, I work with brand partners who use these AI forecasting tools, and I see the difference in their order confidence. The brands that arrive with a data-backed collection plan place larger initial orders, experience fewer mid-season cancellations, and reorder winning styles with conviction. The brands that arrive with a collection built on intuition alone are the ones who call me mid-season asking to reduce their production quantities.
How Does "Social Media Sentiment Analysis" Detect Emerging Trends 6-12 Months Before They Hit Wholesale Showrooms?
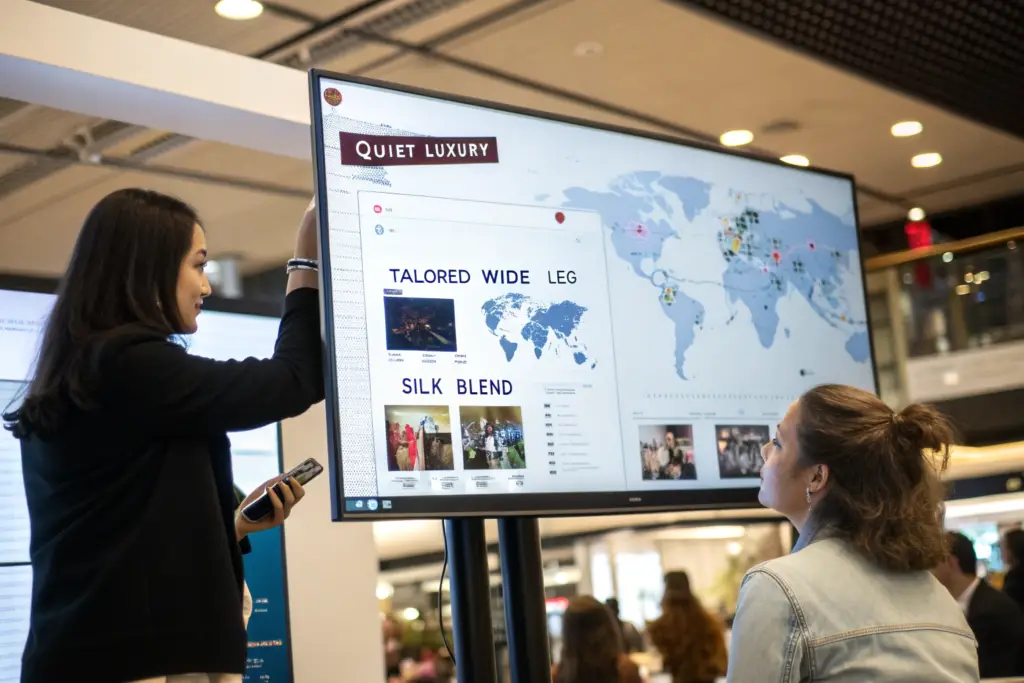
A New York-based premium basics brand once noticed a sudden, unexplained spike in demand for their wide-leg linen trousers. The style had been a steady, moderate seller for two seasons, then suddenly doubled in weekly sales velocity over a three-week period. The brand had no explanation. They reordered more fabric and scaled production, but by the time the replenishment arrived, the demand had plateaued. What the brand had missed was a viral TikTok video posted by a mid-tier fashion influencer six weeks earlier, in which she styled the exact trousers in a "quiet luxury summer capsule" video that accumulated 4.2 million views. The brand had experienced an AI-detectable trend signal six weeks before the demand spike, but they were not monitoring the data.
Social media sentiment analysis detects emerging trends 6-12 months before they hit wholesale showrooms by using natural language processing AI to continuously scan millions of social media posts, influencer captions, and image hashtags across TikTok, Instagram, and Pinterest, identifying and quantifying the frequency and velocity of specific garment-related keywords—such as "barrel leg jeans," "sheer layering," or "elevated basics"—and detecting the acceleration point where casual mentions become a statistically significant, sustained conversation, providing a quantitative signal that a specific style, silhouette, or detail is transitioning from niche early-adopter adoption to mainstream consumer demand.
A traditional trend forecaster attends runway shows, reads fashion magazines, and interviews designers. By the time a trend appears on a runway, it has already been gestating in niche online communities for months. AI sentiment analysis detects the trend at the gestation stage, when a specific style is being discussed and shared by early adopters on social media, months before it appears in a fashion publication or a wholesale showroom. The AI is not predicting the future; it is detecting the present conversation that the traditional fashion industry has not yet noticed.
How Does "Image Recognition AI" on Pinterest and Instagram Detect a Specific Silhouette Trend Before It Has a Name?
Image recognition AI scans millions of fashion images and identifies recurring visual patterns—a specific pant width, a specific sleeve shape, a recurring collar detail—even before the trend has been named by the fashion press. The AI might detect that "voluminous, rounded shoulder sleeves" are appearing with increasing frequency in high-engagement posts, and flag this as an emerging silhouette trend.
Why Is "Engagement Velocity"—The Rate of Growth in Mentions—More Important Than the Absolute Number of Mentions?
A trend that has 100,000 total mentions but a flat or declining growth rate is a saturated, potentially fading trend. A trend that has only 5,000 mentions but a 200% month-over-month growth rate in mentions is an emerging trend with significant future potential. AI trend forecasting prioritizes velocity over volume.
What "Search Query Trend Data" Reveals About Wholesale Buyer Intent That Social Media Sentiment Cannot?
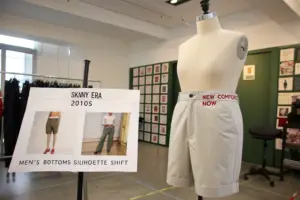
A Chicago-based wholesale apparel distributor once stocked a large inventory of skinny-fit chinos based on their historical sales data, which showed skinny as their bestselling silhouette for the past five years. The inventory sat. Wholesale buyers were not reordering. The distributor could not understand why their historically reliable bestseller had suddenly stalled. What they had not tracked was the Google search query data, which showed that searches for "wide leg chino wholesale" had increased by 340% over the preceding nine months, while searches for "skinny chino wholesale" had declined by 62%. The wholesale buyers had already shifted their intent. The search data had been signaling the shift for three quarters, but the distributor was looking at historical sales data instead of forward-looking search intent.
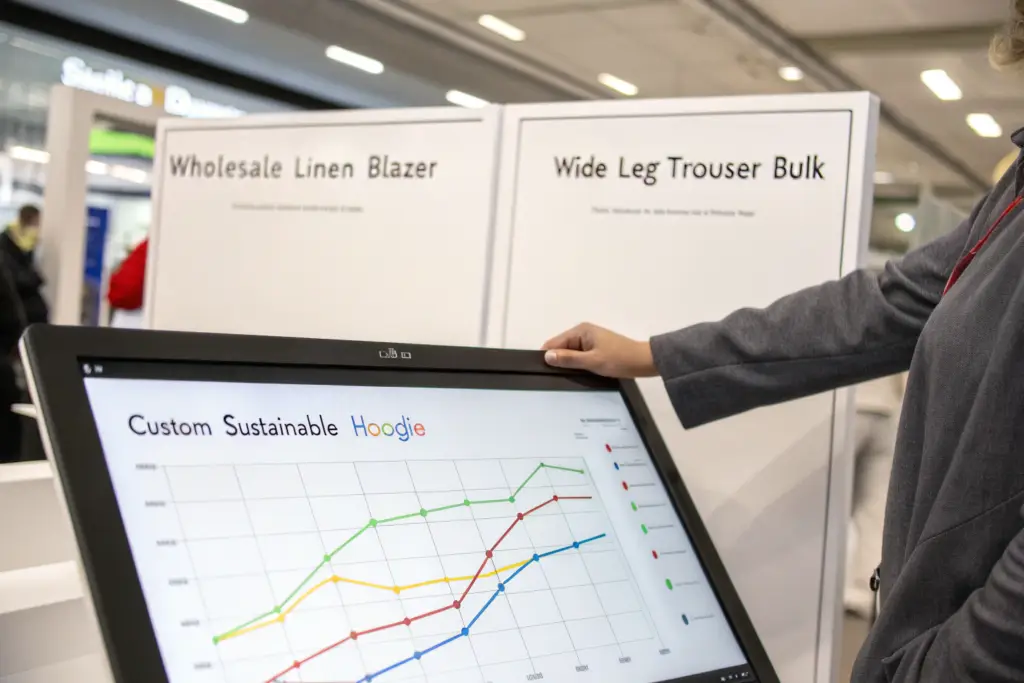
Search query trend data reveals wholesale buyer intent that social media sentiment cannot because a search query—such as "wholesale linen blazer USA" or "plus size activewear bulk"—is a direct expression of purchase intent from a buyer who is actively sourcing a specific product category, whereas a social media mention or an influencer post reflects passive interest, inspiration, or entertainment, and the search query data provides a quantitative, real-time measure of which specific product categories, styles, and attributes wholesale buyers are actively seeking to purchase, allowing brands to align their collection development with documented demand rather than predicted demand.
Social media tells you what consumers are talking about. Search data tells you what buyers are trying to buy. The difference is the gap between interest and intent. A consumer might like, share, and comment on a hundred fashion posts without ever intending to purchase a single garment. A wholesale buyer searching for "wide leg trouser wholesale minimum 200 pieces" has a purchase order ready. Search data captures the demand that is about to convert into orders.
How Does "Google Trends Seasonal Decomposition" Separate a Genuine Long-Term Trend Shift From a Predictable Seasonal Fluctuation?
Google Trends data can be decomposed into its seasonal, cyclical component—the predictable rise and fall of "winter coat wholesale" every September through November—and the underlying long-term trend component. A genuine trend shift is visible when the long-term trend line changes direction independently of the seasonal cycle.
Why Should a Brand Track "Long-Tail Specific Search Queries" Like "Wholesale Organic Cotton Baby Romper" Rather Than Just "Baby Clothes Wholesale"?
A broad search term like "baby clothes wholesale" represents unfocused, early-stage browsing. A long-tail specific query like "wholesale GOTS organic cotton baby romper USA" represents a wholesale buyer with a specific, documented need who is close to making a purchasing decision. The long-tail queries reveal the specific product attributes—organic, GOTS-certified, cotton, romper, USA—that buyers are actively seeking.
How Do "Competitor Sell-Through and Bestseller Aggregation" Platforms Quantify What Styles Are Actually Selling, Not Just Generating Buzz?
A Portland-based outdoor lifestyle brand once developed a new fleece jacket style based on a trend that had generated massive social media buzz—an oversized, brightly colored, retro-patterned fleece. The buzz was real. The Instagram engagement was phenomenal. The brand produced 4,000 units. The sell-through was 31%. The buzz had been generated by fashion influencers who received the jackets for free and posted sponsored content. The actual paying customers, it turned out, were not buying the trend in the volumes the buzz suggested. A competitor analytics platform, had the brand consulted it, would have shown that similar oversized printed fleeces from three competing brands were selling through at 28-42% and being heavily marked down. The buzz was loud. The sales were silent.
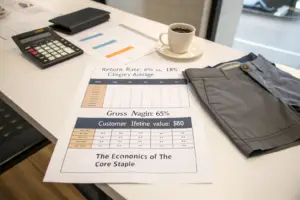
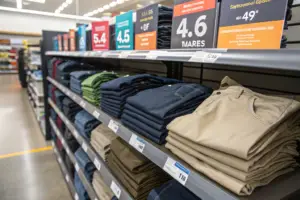
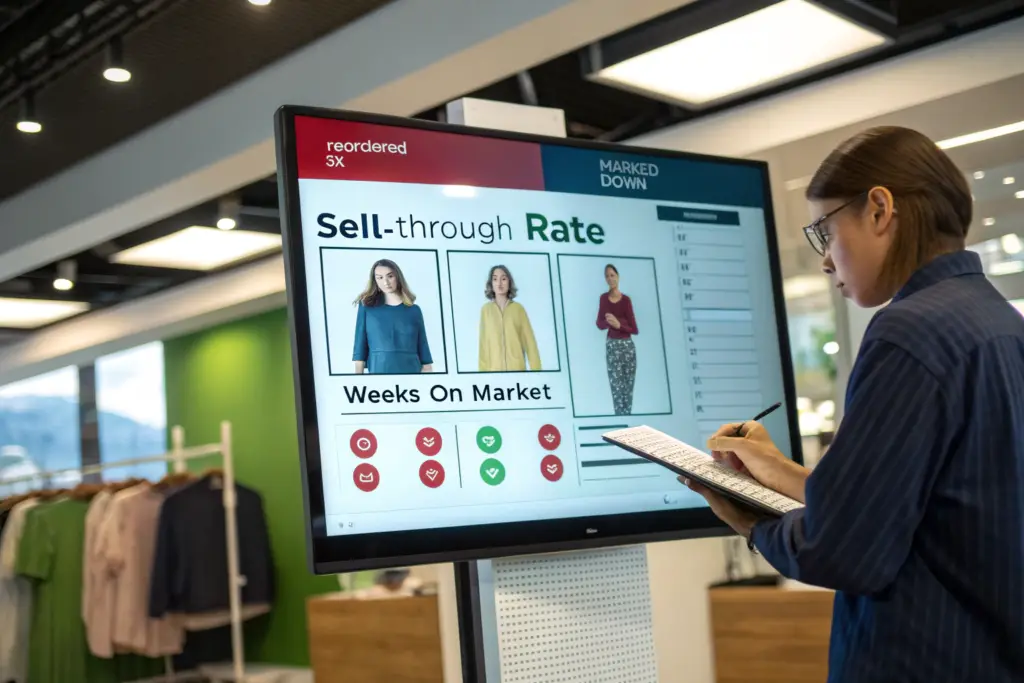
Competitor sell-through and bestseller aggregation platforms quantify what styles are actually selling by continuously monitoring public e-commerce data—product page reviews counts, inventory availability signals, markdown frequency and depth, and "bestseller" badge assignments—across hundreds of retail websites, and translating these signals into estimated sell-through rates, inventory turnover velocity, and pricing trajectories for specific product categories and styles, distinguishing the styles that are generating genuine consumer purchases at full price from the styles that are generating social media engagement but failing to convert to sales.
Social media buzz is a measure of attention. Sell-through data is a measure of commercial success. A style can generate millions of views, likes, and comments and still sell poorly because the audience engaging with the content is not the audience purchasing the product. Competitor sell-through data cuts through the buzz and reveals the hard commercial reality of which styles are actually converting to full-price sales.
How Does "Review Velocity Analysis" Estimate a Competitor's Unit Sales From the Rate of New Customer Reviews?
A product that is selling well accumulates customer reviews at a steady, predictable rate relative to its total unit sales. By tracking the rate at which new reviews appear on a competitor's product page—a publicly visible data point—AI platforms can estimate the product's unit sales volume with reasonable accuracy.
Why Is "Markdown Frequency and Depth Monitoring" a More Honest Indicator of a Style's Failure Than Low Review Counts?
A product with few reviews might simply be new. A product that has been on the market for eight weeks, has accumulated few reviews, and has been marked down from $128 to $88 to $58 is a clear commercial failure, regardless of the initial social media buzz. Markdown tracking reveals the styles that retailers are desperately trying to liquidate.
How Do You Integrate AI Trend Data Into Your Line Planning to Create a "Quantitatively Balanced" Collection?
A Denver-based activewear brand once built their entire seasonal line plan in a two-day creative sprint, selecting styles based on the design team's preferences, a few competitor reference samples, and what "felt right." The collection was 80% new, untested styles and 20% carryover bestsellers. The result was a 52% full-price sell-through, with several styles selling fewer than 20 units across all channels. The following season, the brand integrated AI trend data into their line planning. They assigned each proposed style a "Style Probability Score" based on search trend momentum, social media sentiment velocity, and competitor sell-through data. Styles scoring above 70% received large production allocations. Styles scoring between 40-70% received small test quantities. Styles scoring below 40% were cut from the line entirely. The result was a 78% full-price sell-through.
To integrate AI trend data into line planning, the brand must assign every proposed style a quantitative "Style Probability Score" based on a weighted composite of the three AI data streams—social media sentiment velocity for the specific silhouette and detail, search query trend momentum for the product category, and competitor sell-through performance for similar styles—and then use this score to determine the production quantity allocation, with high-scoring styles receiving the largest commitments, mid-scoring styles receiving small-batch test quantities to validate the AI prediction with real market data, and low-scoring styles being eliminated before sampling costs are incurred.
The AI probability score is not a crystal ball. It is a quantitative hypothesis about a style's commercial potential. The high-scoring styles represent the styles where the data signals are strongest and most aligned. The mid-scoring styles represent styles where the data is ambiguous and a small, real-world market test is the only way to validate or reject the hypothesis. The low-scoring styles represent styles where the data is actively negative, and the brand should not invest in sampling and production.
How Is a "Style Probability Score" Constructed Using a Weighted Average of the Three Data Streams?
The brand assigns a weight to each data stream based on its historical predictive accuracy for their specific market segment. For example: Search Trend Momentum (40% weight, because it represents expressed purchase intent), Competitor Sell-Through (35% weight), and Social Media Sentiment Velocity (25% weight). The style's composite score is the weighted average of its normalized score on each dimension.
Why Should "Mid-Scoring Styles" Receive "Small-Batch Test Quantities" Rather Than Being Cut Entirely?
A mid-scoring style is a data ambiguity. The AI signals are mixed—perhaps search interest is strong but social media sentiment is weak. A small, 200-300 unit test order allows the brand to test the AI hypothesis in the real market. If the style sells well, the brand reorders. If it sells poorly, the financial exposure is limited to 200 units, not 2,000.
Conclusion
Advanced AI trend forecasting transforms seasonal style selection from an intuitive, subjective guessing process into a data-informed, quantitatively defensible commercial decision. Social media sentiment analysis detects emerging silhouettes, colors, and details at the early-adopter stage, months before they appear in traditional fashion media. Search query trend data reveals the specific product categories and attributes that wholesale buyers are actively seeking to purchase, capturing intent rather than passive interest. Competitor sell-through and bestseller aggregation quantifies which styles are actually selling at full price, distinguishing commercial winners from social media hype. Integrating these three data streams into a weighted Style Probability Score for each proposed style allows the brand to allocate production quantities with confidence, test data-ambiguous styles with small batches, and eliminate data-negative styles before incurring sampling and production costs.
At Shanghai Fumao, I work with brand partners who arrive with AI-informed line plans and data-backed style probability scores. These are the brands who place confident, larger initial orders, experience fewer mid-season quantity reductions, and reorder winning styles based on real market data. My production planning system is designed to accommodate both the large, confident orders for high-scoring styles and the small, rapid-turnaround test batches for mid-scoring styles that the brand wants to validate.
If you are a brand buyer who wants to integrate AI trend forecasting into your next season's line planning, and you need a manufacturing partner who can produce both confident volume orders and small test batches with equal reliability, contact my Business Director, Elaine. She can share our production planning template that accommodates AI-informed quantity allocations, our rapid replenishment process for data-validated styles, and our minimum order quantities for test batches. Reach Elaine at: elaine@fumaoclothing.com. Select your styles with data, not intuition.