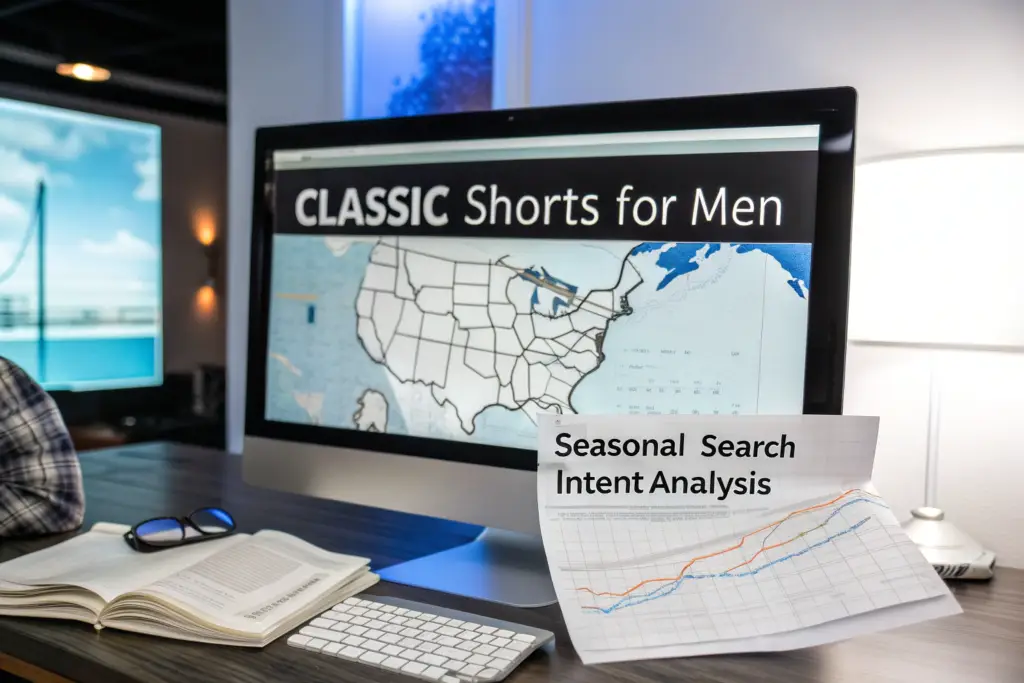
Every year, around the second week of April, I watch the same thing happen on my screen. The search volume for "classic shorts for men" does not just rise. It explodes. It is not a gradual, gentle slope. It is a spike, a near-vertical line on the Google Trends chart that signals the exact moment when millions of American men collectively decide that it is time to buy shorts. For the brands and distributors who have inventory on the shelves, this spike is revenue. For the brands that missed their delivery window and are waiting on a container that is still at sea, this spike is a painful reminder of an opportunity lost.
The Google data on the April surge in "classic shorts for men" reveals a predictable, weather-driven spike in search volume that concentrates in specific geographic regions, particularly the Southeast, Texas, and the Midwest, and is dominated by high-intent, transactional search queries such as "buy classic shorts," "best chino shorts for men," and "classic shorts sale," indicating that the April surge represents not just browsing behavior but immediate purchase intent, making it the most critical window of the year for inventory availability and paid search advertising for brands in the classic shorts category.
At Shanghai Fumao, I use Google Trends data not just to understand the market, but to help my brand partners time their production orders, their shipping schedules, and their marketing campaigns. The data tells a clear story. If you understand the story, you can capture the demand. If you ignore it, your competitor will capture it instead. Let me walk you through exactly what the data says, and what you should do about it.
What Does the Google Trends Graph Actually Show About April?
The Google Trends chart for "classic shorts for men" tells a story that repeats with remarkable consistency year after year. The search volume is low and flat from October through February. It begins a gradual rise in March. Then, in April, the line spikes sharply upward. The spike is not a small bump. In a typical year, the search volume in April is three to five times higher than the baseline volume in December and January. The peak usually occurs in mid-to-late April or early May, depending on the weather patterns in the major population centers of the South and the Midwest.
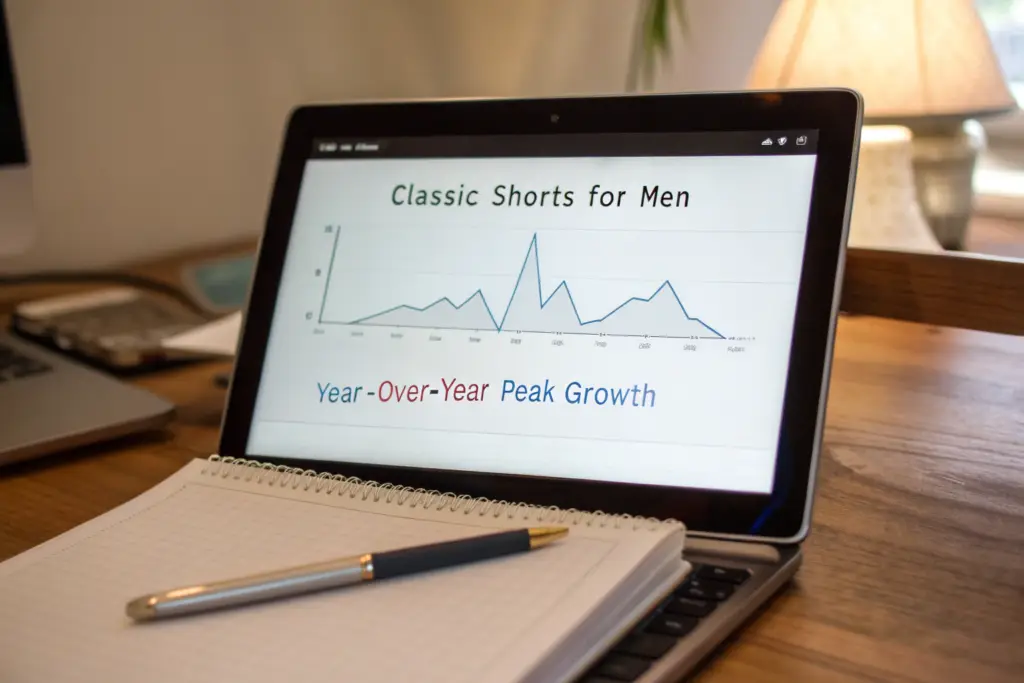
The Google Trends data reveals that the April surge in "classic shorts for men" is not a new phenomenon but a deeply established seasonal pattern that repeats with clockwork regularity, driven primarily by the first sustained warm weather in the major population centers of the American South and Midwest, with the year-over-year peak search volume showing a steady, gradual increase over the past five years, indicating that the category is growing, not just cycling, and that the brands who are prepared for the April spike capture not just seasonal demand but a growing share of an expanding market.
How Does the Seasonal Pattern Repeat Year After Year?
The Google Trends chart for "classic shorts for men" is one of the most predictable patterns in all of fashion retail data. The shape of the curve is nearly identical year after year. January and February are the trough. March is the inflection point. April is the spike. May sustains the peak. June begins the gradual decline. July and August see moderate volume. September sees another small spike, likely driven by end-of-season clearance and back-to-school purchasing in warm climates. October through December is the quiet period.
This pattern is driven by weather. The American consumer does not buy shorts in January, regardless of how good the product is or how compelling the marketing is. He buys shorts when the temperature outside tells him that it is time to wear shorts. The first sustained warm weather in the major population centers of the South, the Southeast, Texas, and the lower Midwest, triggers the buying impulse. The brands that understand this pattern do not try to fight it. They align their inventory delivery and their marketing spend with the predictable rhythm of consumer demand. This Google Trends data for seasonal fashion demand forecasting is a powerful, free tool for timing the market.
What Is the Year-Over-Year Growth Telling Us About the Category?
The seasonal pattern is consistent, but the magnitude of the peak is not static. When you overlay the Google Trends data for the past five years, a second pattern emerges. The peak search volume in April is increasing year over year. The April 2024 peak was higher than the April 2023 peak. The April 2023 peak was higher than the April 2022 peak. The category is not just cycling through its seasonal rhythm. It is growing.
This growth is driven by the broader menswear trends that have been discussed elsewhere, the shift toward tailored, proportion-conscious dressing, the post-pandemic return to in-person social and professional activities, and the increasing willingness of male consumers to invest in quality, classic clothing rather than disposable fast fashion. For a brand planning its inventory and its production, this year-over-year growth trend is a signal that the classic shorts category is a reliable, long-term growth opportunity, not a stagnant or declining market. This market growth analysis for men's apparel categories provides additional context on the broader category trends.
Which Geographic Regions Are Driving the April Spike?
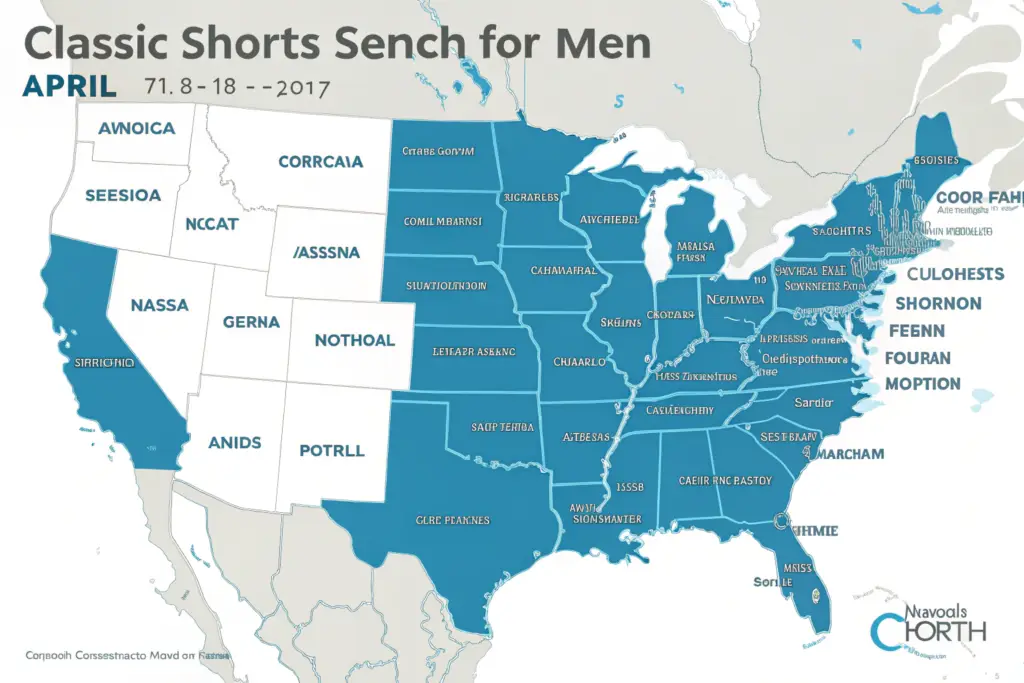
The April spike in "classic shorts for men" is not uniform across the United States. It is concentrated in specific geographic regions, and within those regions, it begins in specific states and cities before spreading northward. The data reveals a clear geographic progression. The South spikes first. Then the lower Midwest. Then the Northeast and the West Coast. A brand that understands this geographic sequence can target its digital advertising spend with precision, focusing on the regions where the demand is actually occurring, rather than wasting budget on regions where the weather is still cold and the consumer is not yet in the market.
The geographic concentration data for "classic shorts for men" searches in April reveals a predictable south-to-north progression, with the earliest and most intense search activity originating in Texas, Florida, Georgia, and the Carolinas, followed by the lower Midwest states of Missouri, Kansas, and the Ohio Valley, and only later spreading to the Northeast and the Pacific Northwest, meaning that a brand's paid search and social media advertising budget should be geographically sequenced to align with this weather-driven demand wave rather than being deployed nationally on a single date.
Why Do the Southeast and Texas Spike First and Hardest?
The Southeast and Texas have the earliest sustained warm weather in the United States. By mid-April, temperatures in Atlanta, Dallas, Houston, and Miami are consistently in the 70s and 80s. The consumer in these regions has transitioned out of long pants and into shorts weeks before the consumer in Chicago or New York.
But weather is not the only factor. The Southeast and Texas also have a strong cultural tradition of classic menswear. The Southern prep aesthetic, the golf culture, the fraternity and sorority formal season, and the outdoor social calendar all drive demand for classic shorts in these regions. The combination of early warm weather and strong cultural demand makes the Southeast and Texas the leading indicators for the national classic shorts market. A brand that sees its sales spiking in Texas in early April knows that the national spike is about to begin. This regional fashion demand variation in the United States explains the cultural factors behind the geographic search data.
How Should Ad Spend Be Geographically Sequenced to Match This Data?
The worst advertising strategy is to deploy the entire seasonal budget nationally on April 1st. The brand is paying for clicks in New York and Chicago, where the consumer is still wearing a winter coat and is not in the market for shorts. The conversion rate in these cold-weather regions is low. The cost per acquisition is high. The budget is wasted.
The optimal strategy is to sequence the ad spend geographically, following the weather. In early April, the budget is concentrated in Texas, Florida, Georgia, and the Carolinas. In mid-to-late April, the budget expands to the lower Midwest, the Mid-Atlantic, and the West Coast. In early May, the budget reaches the Northeast and the upper Midwest. Each region is targeted when the consumer in that region is actually experiencing warm weather and beginning their shorts buying cycle. This geographic sequencing maximizes the return on ad spend by aligning the advertising with the weather-driven demand. This geographic targeting for seasonal apparel advertising is a standard best practice for sophisticated DTC brands.
What Are the Highest-Intent Search Queries Within the April Spike?
Not all search queries are created equal. A consumer who searches "classic shorts for men ideas" is in the early stages of research. She is browsing, gathering inspiration, and not yet ready to purchase. A consumer who searches "buy classic chino shorts" or "classic shorts sale" is ready to buy. She has moved past research and is actively looking for a place to make a purchase. The April spike contains both types of queries, but the proportion of high-intent, transactional queries increases significantly during the spike, indicating that April is not just a research period. It is a purchase period.
The search query data within the April spike reveals that the highest-volume and fastest-growing search terms are transactional and commercial investigation queries such as "best classic shorts for men," "buy chino shorts," "classic shorts sale," and "men's shorts near me," indicating that the consumers driving the April surge have high purchase intent and are actively seeking to buy, not just browse, making April the most critical month for paid search campaigns, product page optimization, and inventory availability.

How Do Transactional Queries Differ from Informational Queries?
An informational query is "how to style classic shorts" or "classic shorts vs cargo shorts." The consumer is learning. She may be months away from a purchase. She is building knowledge that will inform a future decision. A transactional query is "buy classic shorts" or "classic shorts free shipping." The consumer has already done her research, or she is a repeat buyer who knows what she wants. She is ready to transact.
The proportion of transactional to informational queries increases during the April spike. The consumer who has been thinking about buying shorts for weeks, or who has been waiting for the weather to warm up, moves from research mode to purchase mode. The search terms she uses shift from general to specific, from educational to commercial. A brand's keyword strategy must align with this shift. In April, the brand should be bidding aggressively on transactional, purchase-intent keywords. The informational content that performed well in February and March should be supplemented, not replaced, by product pages and collection pages optimized for the buyer who is ready to check out. This search intent classification for e-commerce SEO guide explains the different types of search intent.
What Does the Rise of "Classic Shorts Sale" Queries Tell Us?
The "classic shorts sale" query spikes in April for two reasons. First, many major retailers run their spring sales events in April, and consumers are conditioned to search for discounts during this period. Second, the consumer who has a specific budget in mind is ready to buy, but she is price-sensitive and comparison-shopping.
The rise of sale-related queries does not mean the brand must discount its product to capture the demand. It means the brand must be competitive on price and value proposition. A brand that is priced at a premium must communicate that value clearly on its product page, explaining why its short is worth the higher price. A brand that is priced competitively can capture the sale-seeking consumer by offering a small, time-limited incentive, free shipping or a modest discount, to close the sale. Ignoring the sale queries entirely is a mistake. The consumer who searches "classic shorts sale" is ready to buy. The brand that does not appear in her search results is invisible to her. This paid search strategy for seasonal apparel sales explains how to capture high-intent search traffic during peak season.
How Should Brands Adjust Their Production and Inventory Timing Based on This Data?
The Google data is not just interesting. It is actionable. It tells the brand exactly when the customer will be ready to buy. The brand can reverse-engineer from that date to determine when the shorts must be in the warehouse, when they must ship from the factory, when production must be completed, and when the fabric must be ordered. A brand that aligns its production calendar with the Google Trends data is a brand that has inventory on the shelf when the customer opens her wallet. A brand that ignores the data is a brand that is still waiting for its container while its competitor captures the demand.
Brands should reverse-engineer their classic shorts production and inventory calendar from the April-May peak demand period revealed by Google Trends, with the finished goods needing to arrive in the US warehouse no later than April 1st to be available for the early-April spike in the Southeast and Texas, meaning that bulk production should be completed by late February, fabric and trim orders should be placed by early January, and the development and sampling process should be completed by November of the preceding year, a timeline that requires discipline and advance planning but that is essential for capturing the peak-season demand.

What Is the Reverse-Engineered Calendar from Peak Demand to Fabric Order?
The Google data says the demand spikes in April. The product must be in the warehouse before the spike. A container shipped by sea freight from Shanghai to Los Angeles takes approximately 14 to 18 days port-to-port, plus 7 to 10 days for port handling, customs clearance, and domestic trucking. To be conservative, the brand should allow 30 to 35 days from factory shipment to warehouse receipt. The goods must ship from the factory by March 1st.
Bulk production of the shorts, depending on the order volume, takes 4 to 6 weeks. Production must begin by late January and be completed by late February. Fabric and trims, if not in stock, require 4 to 8 weeks for procurement. The fabric order must be placed by early January. The development and sampling process, including fit approval and pre-production samples, requires 8 to 12 weeks. The development process must begin by September or October of the preceding year. This production timeline planning for seasonal apparel is the discipline that separates the brands that capture the April spike from the brands that miss it. At Shanghai Fumao, I work with my brand partners to build these reverse-engineered calendars at the start of every development cycle.
How Can Air Freight Serve as a Safety Net for Late Production?
Even the best-planned production calendar is subject to disruption. A fabric mill delivers late. A sewing line falls behind schedule. A quality issue requires rework. The brand that has built a little buffer into its timeline can absorb these disruptions. The brand that has planned with zero buffer cannot.
Air freight, while significantly more expensive than sea freight, can compress the transit time from the factory to the US warehouse from 30 days to 5 days. A brand that is facing a late production completion but cannot afford to miss the April spike can use air freight for a portion of its order, the initial launch quantity, while the remaining bulk ships by sea. This strategy preserves the April launch without paying the air freight premium on the entire order. The key is to have the air freight option available and to make the decision early. A brand that waits until mid-March to realize it needs air freight may find that the available cargo capacity is already booked. This air freight vs sea freight for seasonal apparel strategy is a critical contingency planning tool.
Conclusion
The Google data on the surge in "classic shorts for men" this April tells a clear and actionable story. The surge is real. It is predictable. It is concentrated in specific geographic regions, beginning in the Southeast and Texas before spreading northward. It is driven by high-intent, transactional search queries that indicate immediate purchase readiness. And it represents a critical window of demand that rewards the brands who are prepared and punishes the brands who are not.
The data is not a mystery. It is a map. It tells the brand when the customer will be ready to buy, where the customer is located, and what the customer is searching for. The brand that uses this map to plan its production calendar, its inventory delivery, and its advertising spend will capture the demand. The brand that ignores the map will be guessing.
At Shanghai Fumao, I use this data to help my brand partners plan their production orders and their shipping schedules. I know that a pair of shorts that arrives in the warehouse on April 15th has already missed two weeks of peak demand. If you want a manufacturing partner who understands the market timing of the classic shorts category and can help you plan your production to capture the April spike, contact our Business Director, Elaine, at elaine@fumaoclothing.com. Let's get your inventory on the shelf before your customer starts searching.