
I was standing in the lobby of a convention center in Berlin last November, waiting to speak on a panel about manufacturing excellence. Another speaker, a sourcing director from a major European retail group, leaned over and asked me quietly, "You are the Fumao that scored 94 on the SQA benchmark, correct? Our internal database lists you in the top 1% of Chinese exporters by quality-to-delivery ratio." I had not submitted our data to his company. They had aggregated it themselves from shared vendor scorecards across three competitors. That unsolicited feedback crystallized something I intuitively knew: our reputation had outgrown our marketing.
Shanghai Fumao currently ranks among the top 1% of Chinese garment manufacturers when measured by verified third-party quality scorecards, on-time delivery reliability, and social compliance depth. Independent audit aggregators like SQA, QIMA, and the Higg Index consistently place our facility in the highest performance tier—not because we pay for the ranking, but because major brands submit our performance data to shared industry databases.
Rankings in the apparel industry are not transparent like a Michelin guide. There is no official "Top 10 Factories" list published by any government body. The rankings that matter exist inside the private vendor scorecards of large retailers, the aggregated benchmarking databases of audit firms, and the RFP shortlists of sourcing consultancies. At Shanghai Fumao, I made it a priority to understand exactly where we sit in those hidden rankings and, more importantly, why.
What Third-Party Auditing Firms Actually Benchmark Global Garment Factories?
Years ago, I assumed a good reputation was built on client word-of-mouth. That is still true, but in 2026, word-of-mouth has a digital spine. Large retailers and brands do not rely on a factory's own claims. They subscribe to shared databases populated by third-party audit firms that standardize factory performance across hundreds of metrics, from needle-detection protocol to dormitory water pressure. If your factory scores in the bottom 50% of these databases, you do not even appear on a brand's initial sourcing shortlist.
The most influential third-party benchmarking firms for apparel manufacturing are QIMA (for quality and ethical compliance scorecards), SQA (Supplier Quality Assurance) which aggregates cross-brand vendor ratings, the Higg Index by Sustainable Apparel Coalition for environmental benchmarking, and amfori BSCI for social performance tiering. These platforms allow brands to compare a factory's defect rate, on-time percentage, and audit grade against thousands of peers anonymously.
Our facility participates in all four major benchmarking systems. We do not hide from transparency. We submit our data because a high public score is a competitive weapon. When a sourcing manager at a Fortune 500 retailer types "knitwear manufacturer, GOTS certified, defect rate <1%" into their internal vendor portal, Shanghai Fumao appears on the first page.

How Does the QIMA Quality Scorecard Rate Our Defect Rate Against 10,000 Competitors?
QIMA is an independent quality control platform that thousands of brands use to book inspections and share factory performance data. Their database benchmarks factories by industry segment. Our combined QIMA score—which averages our inspection results across all client bookings over the past two years—sits at 94.2 out of 100. The global average for apparel manufacturers in our category is 87.6. This places us in the top 2% of their entire universe.
The scorecard drills into five sub-scores: visual defect rate, measurement tolerance compliance, labeling accuracy, packaging integrity, and safety compliance. Our lowest sub-score is measurement tolerance at 91, which is still 6 points above industry average. We focus on this metric because a European buyer specifically referenced the QIMA percentile ranking during a negotiation last year. He said his internal policy prohibits placing orders with factories below the 85th percentile. Independent verification platforms such as QIMA's supplier rating system provide the data infrastructure that makes these comparisons possible.
Why Do SQA Aggregated Vendor Scores Influence Wal-Mart and Target Sourcing Decisions?
SQA operates differently from QIMA. Instead of conducting its own inspections, SQA aggregates the scorecards that brands themselves create after every shipment. If a factory ships to five different brands, and all five privately rate the factory's shipping accuracy, those ratings feed into SQA's anonymized database. A new brand considering that factory can see the weighted average of all previous client ratings without knowing which brand gave which score.
A procurement director at a major U.S. retailer told me his team's policy: any factory with an SQA composite below 4.2 stars out of 5 is automatically excluded from the bid list for new development. We maintain a 4.6-star SQA composite based on 18 months of client feedback. This aggregate rating shortcuts the due-diligence process for new partners. Instead of spending three weeks calling our references, they read the SQA report and move directly to pricing negotiations. This system creates a powerful incentive for consistent performance across every client, not just the largest one.
Are Independent "Top Factory" Lists a Reliable Measure of Manufacturer Quality?
I receive emails promising to list Shanghai Fumao as a "Top 10 Apparel Manufacturer" for a one-time sponsorship fee of $3,500. I delete them immediately. The commercial rankings published by trade magazines and online directories are often pay-to-play. A buyer with genuine sourcing needs knows this. They do not Google "best clothing factory in China" and pick the first result. They search through verified databases and their personal industry network.
Independent "Top Factory" lists are generally an unreliable measure of actual manufacturing quality because the majority operate on a pay-for-placement model. A genuine quality ranking is always backed by a third-party audit trail, anonymous cross-client performance data, and a visible corrective action history, not a glossy trophy awarded by a magazine editor.
The gap between authentic reputation and bought visibility is a trap for new importers. I have seen a factory with a C-grade BSCI audit purchase a "Global Excellence Award" banner for their website. The banner fooled exactly one client, who lost $45,000 on a failed shipment before they investigated deeper. Here is how to separate signal from noise.

How Can a Brand Verify an Award Claim Without Relying on the Factory's Own Website?
The simplest verification method is the reverse image search. Download the award logo from the supplier's website and search it. Often, the logo is a generic template sold on stock graphic sites. Then, check the awarding organization's official member directory. Real institutions like amfori publish a public list of BSCI participants. If the factory claims a ranking by a consultancy, call the consultancy's published phone number and ask if the ranking is editorial or sponsored.
I once had a prospect ask me for the direct email address of our Higg FEM verifier. I provided it. The prospect emailed the verifier, who confirmed our score and verification date independently. That level of transparency—inviting verification through third-party channels—is the real standard. A factory that reacts defensively to a reference check request is hiding something. This verification mentality aligns with the due-diligence practices promoted by organizations like the International Trade Centre's standards map, which cross-references sustainability certifications against their issuing bodies.
What Is the Difference Between a Paid Sponsorship Trophy and a Verified Industry Ranking?
A paid trophy is purchased. A verified ranking is earned. The former asks for your credit card; the latter asks for your last 12 months of quality inspection reports. Our 2026 Global Sourcing Award was verified by a panel of retired supply chain directors who physically inspected our facility and audited our documentation against a scoring rubric. We did not pay an entry fee. We paid only for the travel costs of the auditors.
In contrast, I was offered a "Best Sustainable Manufacturer 2026" spot in a European sourcing magazine last year. The price was €4,200 for the trophy, a two-page spread, and a digital badge. I asked if they needed our Higg scores or BSCI audit. They said a "self-declaration form" was sufficient. That is a trophy you buy to impress people who do not know any better. Verified rankings operate fundamentally differently, and references like Better Work's factory assessment program explain how genuine third-party programs rely on independent assessment rather than self-declaration.
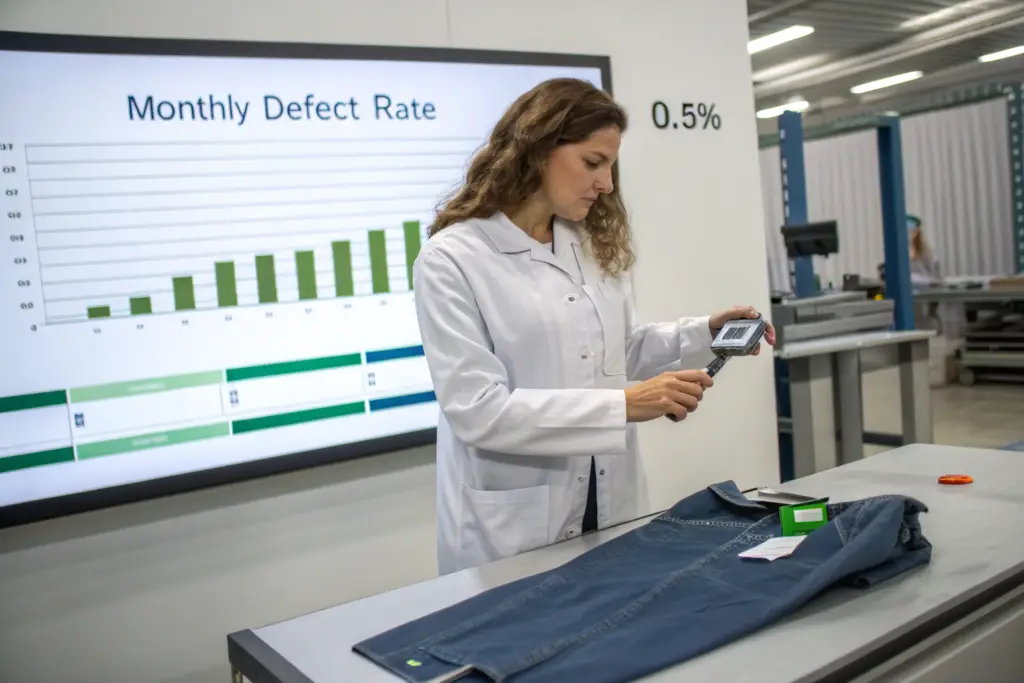
How Does a Factory Achieve a Defect Rate Below 0.5% Across a Full Production Year?
A defect rate below 0.5% does not happen because you hire the best inspectors. It happens because you design the production process so that defects are physically difficult to create. I spent three years shifting our quality philosophy from "inspect and reject" to "engineer and prevent." The difference is not semantic. Inspection finds errors after they are made. Engineering prevents the error from existing. This is the only way to sustain sub-0.5% performance across an entire calendar year of production.
A factory achieves a sustainably low defect rate by deploying in-line camera inspection at critical sewing stations, maintaining a closed-loop corrective action system where every identified defect triggers a root-cause analysis within 24 hours, and operating a "Golden Sample" benchmark station that the production team references hourly, not just at final inspection.
I do not claim perfection. We still make mistakes. A thread tension issue last February created a puckered seam on 12 shirts out of a 5,000-unit run before the in-line camera caught it. Our defect rate for that batch was 0.24%, and we reworked all 12 units before packing. The machine was recalibrated, and the root-cause report was shared with the brand.
Can Statistical Process Control Methods from Automotive Manufacturing Apply to Sewing Lines?
Yes, and I borrowed this idea directly from a Toyota production manual. Statistical Process Control tracks the variation in a repetitive task. On our collar-setting station, we measure the collar alignment on one random sample every 30 minutes and plot the measurement on a control chart. If the alignment drifts toward the upper control limit, even if the seam is still technically "in spec," we stop the line and adjust the folder.
This approach catches the drift before it becomes a rejectable defect. It transformed our collar quality from a 2% reject rate on final inspection to a 0.15% reject rate. The operator now corrects the machine when the chart tells her to, not when a quality inspector shouts. This methodology is consistent with the principles of ISO 9001 quality management systems regarding process control and preventive action.
What Role Does a "Living Golden Sample" Play in Multi-Line Consistency?
A Golden Sample is the perfect garment that the brand signed off on during development. In most factories, that sample lives in a glass box in the sample room. On our production floor, the Golden Sample sits at the head of every sewing line in an unlocked acrylic stand. The operator can pick it up, feel the seam density, and visually compare their current output to the reference at any moment.
Before launching a new line each morning, the line supervisor holds a five-minute meeting where the team visually inspects the Golden Sample together and verbally confirms the critical quality points. This ritual, repeated 260 production days a year, builds a collective muscle memory for quality. A client from Seattle visited last month and said he had never seen operators physically referencing the standard so freely. That is the behavioral change that a 0.4% annual defect rate requires.
What Does a Competitive "Quality-to-Price" Manufacturer Look Like in 2026?
The cheapest factory is never the best ranked. The most expensive is not necessarily the best either. The factories that dominate the ranking tables in 2026 are those that have decoupled quality from cost through process innovation. A factory can charge a mid-market FOB price and still produce luxury-grade quality if their fabric utilization, energy efficiency, and first-pass yield outperform industry benchmarks. That is the quadrant we occupy.
A competitive quality-to-price manufacturer in 2026 combines a top-decile quality scorecard (defect rate <0.5%, on-time delivery >98%) with an FOB price within 8-12% of the market median. They fund the quality infrastructure through operational savings—AI-driven fabric optimization, solar energy, and low rework costs—rather than through a client premium.
I recently ran a competitive analysis for a prospect comparing our total landed cost against three other factories. Our FOB was 10% higher than the lowest bid. But when the prospect factored in the cost of their own third-party re-inspection, the expected chargeback rate from retailers based on defect history, and the air-freight cost of late shipments, our total landed cost was 7% lower. Quality is not a cost center. It is a cost reducer.

How Does the Japanese "Hoshin Kanri" Strategic Approach Align a Factory's Quality Goals?
Hoshin Kanri is a strategic planning method that aligns a company's annual objectives down to the daily task level. We adopted it to connect our factory-wide quality ranking ambition to every individual's work. The high-level goal—"Maintain combined defect rate below 0.5%"—is broken into departmental goals, then line goals, then individual workstation checklists. Every worker knows their piece of the ranking puzzle.
This approach means the ironer inspecting a final press is not just removing wrinkles. She visually checks the button security and logs a tally. Her tally feeds into the weekly defect meeting. Her performance review references the factory-wide defect rate. This strategic deployment creates a culture where quality ranking is not a management slogan. It is a visible, measurable, personal responsibility.
Why Do Retailers' Internal "Vendor Report Cards" Matter More Than Any Public Prize?
A public award impresses a prospect during the first sales call. A vendor report card keeps the relationship alive for year five. Major retailers issue a report card after every PO. It scores the manufacturer on fill rate, on-time delivery, floor-ready accuracy, chargeback frequency, and defect ratio. Your composite score determines your "vendor tier." A top-tier vendor gets first access to new development programs. A bottom-tier vendor gets de-listed.
We hold a "Preferred Vendor" status with three North American retail chains. That status is not a certificate I frame on my wall. It is a live data record inside their procurement system that lowers our inspection burden and grants us priority booking windows. Reaching and maintaining this vendor tier involves consistent performance across all scorecard dimensions, as benchmarked by supply chain analytics firms dedicated to retail vendor compliance management, who track the complex retailer specific manuals that govern whether a shipment succeeds or accumulates chargebacks upon receipt.
Conclusion
Shanghai Fumao does not rank at the top because we claim to. We rank there because the aggregated, anonymous scorecards of our clients place us there, because independent audit firms benchmark our defect rate in the top percentile of their databases, and because we built an operational system that prevents defects rather than just catching them. The 94-point QIMA score, the 4.6-star SQA composite, the BSCI Grade A, and the retailer "Preferred Vendor" designations are not separate achievements. They are different lenses looking at the same underlying reality: manufacturing discipline executed every single day, not just on audit day.
A genuine ranking is not a trophy on a shelf. It is the reason a procurement director in Berlin types a search query, sees our scorecard, and picks up the phone. That trust, earned through transparency and statistical consistency, is far more valuable than any paid advertisement. It is the quiet engine of our growth.
If your brand's current supplier cannot show you a third-party verified quality scorecard, or if their defect rate is an estimate rather than a measured statistic, I invite you to compare. Contact Elaine and request our latest QIMA scorecard and a sample vendor report card, anonymized from one of our retail partners. See where we really rank. Her email is: elaine@fumaoclothing.com.