
You are staring at a spreadsheet. Last season, your linen wide-leg pants sold out in three weeks. You left money on the table. The season before that, you over-ordered a different silhouette and spent January clearing inventory at 60% off. You lost margin. Both scenarios hurt, but the second one can kill a small brand. Demand forecasting for a seasonal, natural-fiber product feels like predicting the weather six months in advance. Linen is not a basic cotton tee. It has a specific selling window, a specific customer profile, and a sensitivity to macroeconomic trends that synthetic fast fashion ignores. You need a method that is more scientific than gut feeling but more nuanced than a simple year-over-year growth percentage.
Effective demand forecasting for linen wide-leg pants in North America requires layering three data streams: your internal sell-through velocity from the last two seasons, external Google Trends data filtered for the "linen pants" category and its specific style modifiers, and early wholesale account feedback collected through pre-line showings. The most accurate forecast blends quantitative depletion curves with qualitative boutique buyer sentiment, adjusted for the specific lead time your China-based supply chain requires.
My name is Elaine. At Shanghai Fumao, I sit in a unique position. I see the order books of multiple North American brands across different price tiers, from direct-to-consumer startups to established distributors. I see who is increasing their open-to-buy and who is pulling back. I see which silhouettes get reordered in week two and which ones generate silence. This gives me a composite view of demand that a single brand cannot see alone. I want to share the forecasting framework I have watched our most successful clients use. It is not a theoretical model from a textbook. It is a practical, season-tested approach that accounts for the specific quirks of linen, the North American consumer calendar, and the manufacturing lead times you must respect to avoid both stockouts and markdowns.
What Internal Sales Data Signals Should Drive Your Linen Pant Forecast?
Your own sales history is the most reliable forecasting asset you own, and most brands misuse it. They look at total units sold. "We sold 1,000 linen pants last summer, so let's order 1,200 this summer." This is a blunt instrument that ignores the composition of the sell-through. Did 800 of those units sell at full price in the first four weeks, or did 600 sell during a desperate 50% off clearance sale in August? The two scenarios tell completely different stories about true demand. The first scenario suggests unfulfilled demand and room for growth. The second scenario suggests you over-bought and the market rejected your price point, color, or fit. You need to dissect your sales data by week, by color, by size, and by channel.
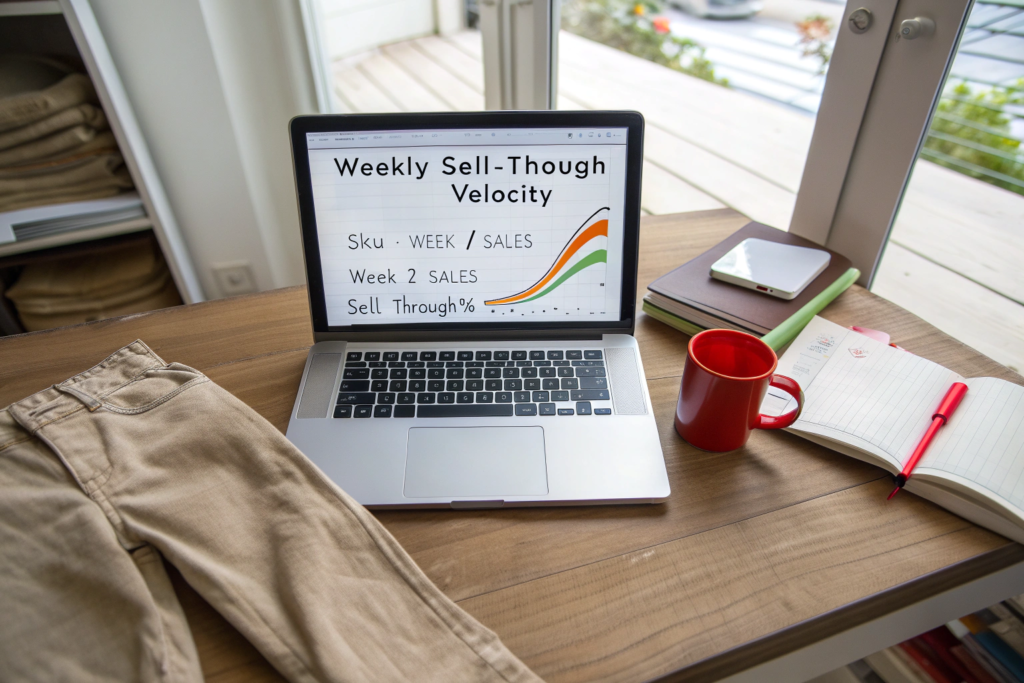
The internal data signals that matter most are your weekly full-price sell-through rate, your color-level depletion curve showing which shades sold out first, and your size-level stockout pattern. A style that achieved a 15% weekly sell-through at full price for four consecutive weeks signals strong, unfulfilled demand, while a style that only sold after a 40% markdown is a warning, not a baseline for growth.
How Does Full-Price Sell-Through Velocity Indicate True Demand?
The velocity at which a product sells at its intended retail price is the purest demand signal. It removes the distortion of discount-driven purchasing. A customer who pays $98 for a pair of linen pants is fundamentally different from a customer who pays $49 on clearance. The full-price customer is buying the style, the fit, and the brand value. The clearance customer is buying a bargain that happened to be available. Forecast based on full-price demand, not total demand.
I worked with a contemporary brand from Austin, Texas, in 2024 to analyze their previous season. They had ordered 800 units of a wide-leg linen pant in a dusty blue colorway. The total sell-through was 92%. A superficial analysis would say, "Great, order more." But when we looked at the weekly data, we found that 70% of the units sold at full price within the first three weeks. The remaining 22% took eight additional weeks and two markdown rounds to clear. The true full-price demand was approximately 560 units, not 736. If they had forecast 920 units for the next season based on the 92% total sell-through, they would have produced 360 units of markdown inventory. The concept of retail sell-through analysis explains this distinction clearly. You must calculate your full-price sell-through rate weekly and stop accepting new inventory once the velocity drops below a threshold, typically 8% per week for seasonal apparel. This requires discipline. The emotional desire to have "just in case" inventory is strong, but the financial cost of excess linen pants sitting in a warehouse in September is stronger.
Why Do Color-Level and Size-Level Depletion Patterns Refine Your Order?
Aggregate data hides the winners and the losers inside your own assortment. Your overall linen pant category may have performed well, but within that category, one color sold out in week one while another color collected dust. If you reorder the whole assortment proportionally, you are simply reproducing the dust collectors.
I advise our clients to build a "color depletion chart." On the x-axis, you plot the weeks of the selling season. On the y-axis, you plot the remaining inventory percentage for each color. The line that drops fastest and earliest is your demand leader. For one of our brand partners in 2024, the "Natural Oatmeal" color sold out by week four. The "Sage Green" took until week ten. They had ordered equal quantities of both. The data told them that the customer wanted neutral, wearable tones, not fashion colors in linen. For the next order, they shifted the color mix to 65% oatmeal and 20% green, adding a new "Warm Sand" as a test at 15%. The sell-through rate improved by 12% overall. Size depletion tells a similar story. Wide-leg pants are often purchased by customers who seek comfort. The size XL and XXL often sell out before Medium. Yet many brands order on a standard size curve that under-indexes extended sizes. Your own sales data should override the generic size curve. If your XL sold out twice as fast as your Medium, increase the XL depth in the next order, even if it feels unconventional. A size curve optimization strategy based on historical depletion is more accurate than any industry standard chart.
How Can External Market Trend Data Validate Your Internal Forecast?
Your internal data tells you what your existing customer did. It cannot tell you what a new customer segment might do, or whether the category as a whole is rising or falling in North American consumer consciousness. For that, you need external market signals. These signals are freely available if you know where to look and how to interpret them. The most accessible tools are Google Trends, social media sentiment analysis, and early wholesale account feedback. These sources provide a macro-level view of whether the "linen wide-leg pants" category is gaining search interest, whether specific style modifiers like "barrel-leg" or "high-waisted" are emerging, and whether boutique buyers are excited or cautious about the upcoming season.
External validation comes from correlating your internal sell-through data with Google Trends search volume for "linen pants" and related style terms over a rolling five-year period, monitoring Pinterest and TikTok for visual trend adoption, and conducting a structured pre-line survey with your top ten wholesale accounts. If your internal data says "grow by 20%" but Google Trends shows category search interest declining 15% year-over-year, reduce your growth assumption accordingly.

How Do You Read Google Trends for Seasonal Linen Demand?
Google Trends does not tell you how many units you will sell. It tells you how many people are searching for the product category. This is a proxy for consumer intent. The critical skill is filtering the data correctly. A search for "linen pants" is too broad. It includes men's linen pants, cheap fast-fashion linen pants, and even linen-blend pants. You must refine the query.
First, set the geographic filter to "United States" and then drill down to your strongest sales regions. If 70% of your sales come from California, Texas, Florida, and New York, focus on those states. Second, set the time range to "Past 5 years." Linen is seasonal, so you need to see the pattern across multiple cycles to identify if the baseline is rising or the peak is getting higher. Third, compare specific style terms. Search "wide-leg linen pants" versus "straight leg linen pants." In early 2025, the "wide-leg" term began to significantly outpace "straight leg" in search volume, confirming the silhouette shift I discussed in a previous article. I analyzed this data with a client in January 2025. The Google Trends for fashion forecasting graph showed that search interest for "linen wide-leg pants" peaked in April and sustained through July, with a smaller secondary peak in January for "resort wear" shoppers. This told us that the demand window was not just Memorial Day to July 4th. There was a pre-spring demand from customers traveling to warm destinations. The brand shifted their delivery from late April to early March to capture the resort window. That single adjustment increased their full-price sell-through by capturing demand that previously went to a competitor. You should check Google Trends quarterly. It costs nothing and provides a macro temperature check that your gut feeling cannot.
What Pre-Line Wholesale Feedback Prevents a Disastrous Overbuy?
If you sell wholesale to boutiques, your retail buyers are your best demand-sensing network. They talk to the end consumer every day. They know what sold last season. They know what their customer is asking for. Too many brands design a collection, produce it, and then present it to buyers as a finished product with no room for input. The smarter approach is a pre-line showing.
A pre-line is a soft launch of samples and swatches to your top ten accounts, usually four to five months before the delivery season. You are not taking orders. You are collecting feedback. You show the linen wide-leg pant in three color options. You ask the buyer: "Which of these three colors would you buy for your store? In what quantity roughly? What price point feels right?" Their answers are qualitative data that you can aggregate. If eight out of ten buyers gravitate toward the natural oatmeal and the dusty terracotta, and only two express interest in the sage green, you have validated your color depletion analysis with external, forward-looking data. I watched a brand avoid a $40,000 mistake by doing a pre-line survey. They loved a "Sunset Orange" linen pant internally. The pre-line buyers universally said, "It's beautiful but my customer won't wear it." They killed the color before production and moved the fabric investment into the core neutrals. The core neutrals sold out. The wholesale buyer feedback integration process turns your buyers from order-takers into collaborative forecasters. They have skin in the game. They want your product to succeed in their store. Listen to them before the fabric is cut, not after.
How Should Supply Chain Lead Times Constrain Your Demand Forecast?
The most mathematically perfect demand forecast is useless if your supply chain cannot execute it within the required time window. Linen wide-leg pants have a hard seasonal deadline. A pair of linen pants that arrives in your warehouse on August 15th has approximately four to six weeks of selling season left in most of North America before the retail mindset shifts to fall fabrics. If your forecast says you will sell 500 units in August, but your supplier delivers them in September, your forecast was not wrong; your lead time planning was wrong. Supply chain constraints must act as a hard boundary on your demand projections.
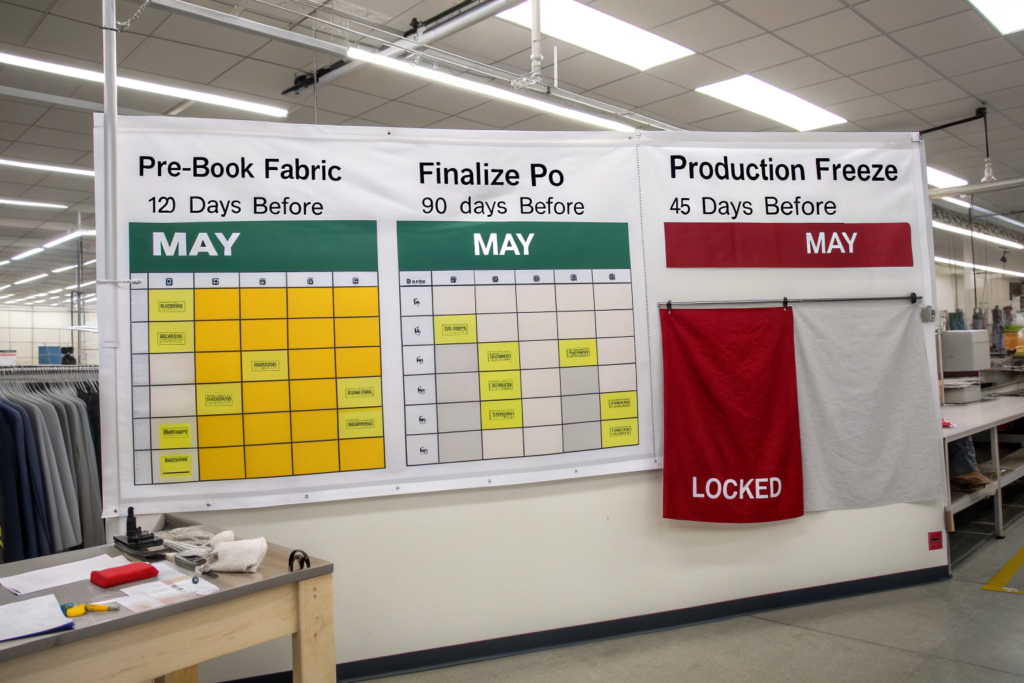
Your demand forecast must be finalized 120 days before your intended in-store date to allow for fabric sourcing and dyeing, 90 days before to lock the cutting and sewing schedule, and 45 days before as the absolute "production freeze" date after which no quantity changes can be made without delaying the shipment. Any demand signal that arrives after the freeze date must be captured in next year's plan, not this year's panic order.
What Is the "Fabric Booking Deadline" and Why Does It Gate Your Forecast?
Linen is not a dead stock fabric that sits on shelves waiting for orders. Quality European flax linen, especially in custom colors, is made to order. The spinning mill needs time to spin the yarn. The weaver needs time to weave the fabric. The dye house needs time to match your lab dip and dye the full lot. This entire chain, from yarn order to finished fabric delivery at the garment factory, takes approximately 45 to 60 days.
This means your fabric must be ordered 45 to 60 days before your garments need to be cut. And your cutting must start 60 days before your shipping date. This pushes the fabric booking decision to roughly 120 days before your intended delivery. At Shanghai Fumao, we manage this by maintaining a "greige fabric bank" of our most popular linen qualities. For core, un-dyed natural linen, we keep a buffer stock that can be custom-dyed within 30 days. This shortens the lead time for repeat orders of neutral colors. But for any custom color or special texture like a bark-weave slub linen, the full 120-day lead time applies. I advise our brand clients to structure their forecast in two tiers. Tier one is "Core Replenishment," representing 70% of the forecast, locked in 120 days out, consisting of best-selling colors and sizes from last season. Tier two is "Test and React," representing 30% of the forecast, using our greige bank for a faster turnaround on new colors or modified silhouettes based on early spring selling. This supply chain lead time segmentation strategy balances the need for both certainty and responsiveness. You are not gambling the entire order on a guess made six months in advance. You are securing the proven core and leaving a smaller, flexible portion for market reaction.
How Does a Production Freeze Date Protect You From Last-Minute Panic?
The most dangerous moment in the forecasting cycle is six weeks before the ship date. You have just seen a competitor launch a linen pant that looks like yours. Your anxiety spikes. You email the factory: "Can we add 200 more units?" The factory, eager to please, says, "Yes, we will try." What happens next is a cascade of compromises. The fabric for the extra 200 units is sourced from a different dye lot and does not match. The sewing line is rushed. The QC is skipped to meet the original shipping deadline. The goods arrive late, or they arrive with quality issues.
The production freeze date is a date after which no changes to quantity, color, or spec are permitted without a signed acknowledgment that the ship date will move or the quality guarantee is void. We enforce this with our clients for their protection. I once had a brand client call me in a panic wanting to add 300 units to an order that was already halfway through the cutting room. I said no. I explained that adding 300 units would require a new fabric dye lot that could not be color-matched perfectly to the in-process lot, and the cutting table was booked for another client's order immediately after. The brand was upset initially, but the original order shipped on time and matched perfectly. They later told me it was the right decision. The production freeze discipline is a sign of a mature, ethical factory. A factory that always says "yes" to last-minute changes is a factory that is willing to compromise your quality or your delivery date. The freeze date should be communicated at the start of the order, written into the purchase agreement, and enforced without exception. This discipline forces you to make your forecasting decisions on time, based on the best available data, rather than reacting to competitive anxiety at the last moment.
Conclusion
Forecasting demand for linen wide-leg pants in North America is a discipline that combines internal data analysis, external market sensing, and strict supply chain time management. Your own full-price sell-through velocity, color depletion curves, and size sell-out patterns provide the quantitative foundation. Google Trends search data and pre-line wholesale buyer feedback provide the qualitative, forward-looking validation that either confirms or challenges your internal assumptions. And your supply chain lead times, anchored by a fabric booking deadline at 120 days and a production freeze at 45 days, provide the hard container within which your forecast must operate.
The goal is not perfect accuracy. A perfect forecast in fashion is a fantasy. The goal is to systematically reduce the two biggest errors: the stockout that leaves money on the table, and the overbuy that forces margin-destroying markdowns. The brands I watch succeed season after season are not the ones with a genius creative director who can predict trends. They are the ones with a disciplined operations manager who builds a forecast from real data, listens to wholesale partners, and respects the physical reality of how long it takes to make a beautiful pair of linen pants.
If you are building your demand forecast for the upcoming season and you want a manufacturing partner who can help you structure a core replenishment program with a greige fabric bank that shortens your lead times on winning styles, I am ready to talk. My name is Elaine, and you can reach me at elaine@fumaoclothing.com. Let's look at your sell-through data from last season and build a production plan that matches your real demand, not your hope.