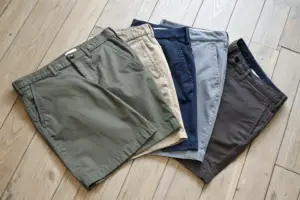

You feel the pressure to have the right product at the right time. You see brands that seem to magically catch a trend just as it takes off. They have the pleated short when everyone suddenly wants pleated shorts. They have the linen-blend short when linen explodes. You wonder if they have a crystal ball. They do not. They have data. Specifically, they have Google Trends. This free, public tool shows you what millions of consumers are actually searching for, in real-time, broken down by region and season. It is the closest thing to a collective consumer consciousness. The brands that win are not guessing. They are reading the data and acting on it before their competitors. You can do the same.
You can use Google Trends to predict the next big classic shorts style by systematically tracking search query data for specific style keywords, analyzing seasonal patterns to time your production calendar, comparing rising versus declining terms to identify momentum shifts, and drilling down into regional data to spot geographic early adopters. The next big style leaves a digital footprint months before it appears in sales data. It shows up as a sustained, multi-year increase in search interest for a specific term, like pleated shorts, elastic waist shorts, or linen shorts. When you combine this search data with your industry knowledge of manufacturing lead times, you can develop and launch the right product just as the demand curve accelerates. Google Trends turns trend guessing into trend forecasting.
At Shanghai Fumao, I use Google Trends data to advise our brand partners on what to develop next. I watch the search patterns. I see which fabric terms, silhouette terms, and feature terms are rising. I compare this data with our production inquiries. When the data and the inquiries align, we know a trend is real. This article is a practical guide to using Google Trends for product forecasting. It covers the key features of the tool, the specific search terms to track, and how to translate data into a production decision.
What Are the Key Google Trends Features for Fashion Forecasting?
Google Trends is a powerful tool, but only if you know how to configure it. The default settings will give you generic, less useful data. You need to adjust the time range, the geographic location, and the search categories to get data that is relevant to the US apparel market. You need to understand the difference between "search term" and "topic," and how to compare multiple terms on the same graph. These features are the controls of the forecasting machine. Learn them, and you can extract actionable insights.
I use Google Trends weekly. I have a saved set of searches that I check every Monday. I compare the search interest for core styles, rising styles, and declining styles. I look at the five-year trend to see the big picture, and the 12-month trend to see the recent momentum. The Google Trends for market research guide explains the technical features. Let me walk you through the key settings and how I configure them for apparel forecasting.
The time range, the geographic filter, and the comparison feature are the three most important controls. Each one shapes the data and the insight. Let's examine how to use each one correctly.
How Should You Set the Time Range, Geography, and Category Filters for Apparel?
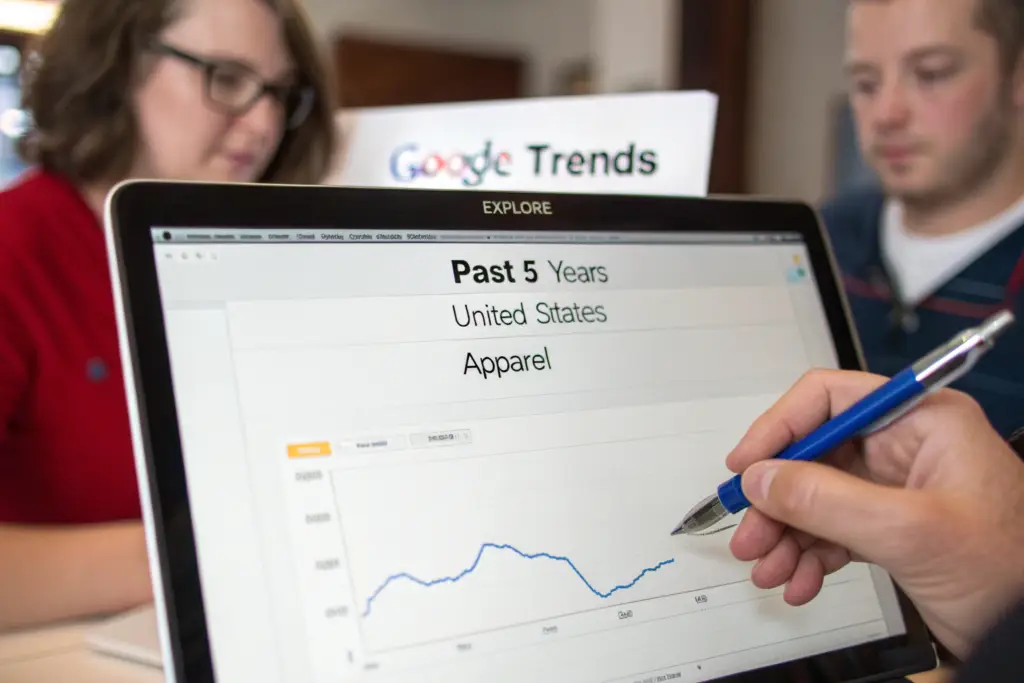
Set the time range to "Past 5 years." This shows you the long-term trend. A spike in the last 3 months could be a seasonal blip or the start of a genuine trend. The 5-year view provides context. Is this the third year in a row that searches for this term have risen in spring? That is a trend. Set the geographic filter to "United States" for the US market. For regional insights within the US, you can drill down later to specific states like California, New York, or Texas. Set the category filter to "Apparel" or leave it on "All categories" if the apparel category is too restrictive for a specific term.
The category filter helps remove irrelevant searches. A search for "shorts" could include movie shorts or electrical shorts. Filtering by "Apparel" cleans the data. However, for very specific terms like "pleated chino shorts," the category filter is less necessary because the term itself is specific to apparel. The Google Trends filtering for market analysis provides guidance on filter combinations.
What Is the Difference Between Comparing Search Terms and Exploring Related Queries?
Comparing search terms allows you to put up to five terms on the same graph. This is how you see which style is winning. Compare "pleated shorts," "flat front shorts," and "elastic waist shorts" over a 5-year period. The relative lines tell the story. The rising line is the trend. The falling line is the fading style. The stable line is the classic.
Exploring related queries shows you the specific searches people are making around a core term. For the topic "chino shorts," the related queries might include "best chino shorts for men," "women's high waisted chino shorts," or "chino shorts with stretch." These related queries reveal the specific features, demographics, and purchase intents that are driving the trend. The Google Trends related queries analysis feature is a goldmine for product development ideas. A rising related query like "linen chino shorts" is a signal to develop that product.
Which Search Terms Reveal the Next Big Classic Shorts Silhouette?
The words consumers type into Google are the most honest expression of their desires. They are not responding to a survey. They are not in a focus group. They are alone with their search bar, looking for what they actually want. By tracking the right search terms, you can see desire forming in real-time. The terms fall into three categories: silhouette terms that describe the shape of the short, fabric terms that describe the material, and feature terms that describe specific details. A rising term in any category is a signal.
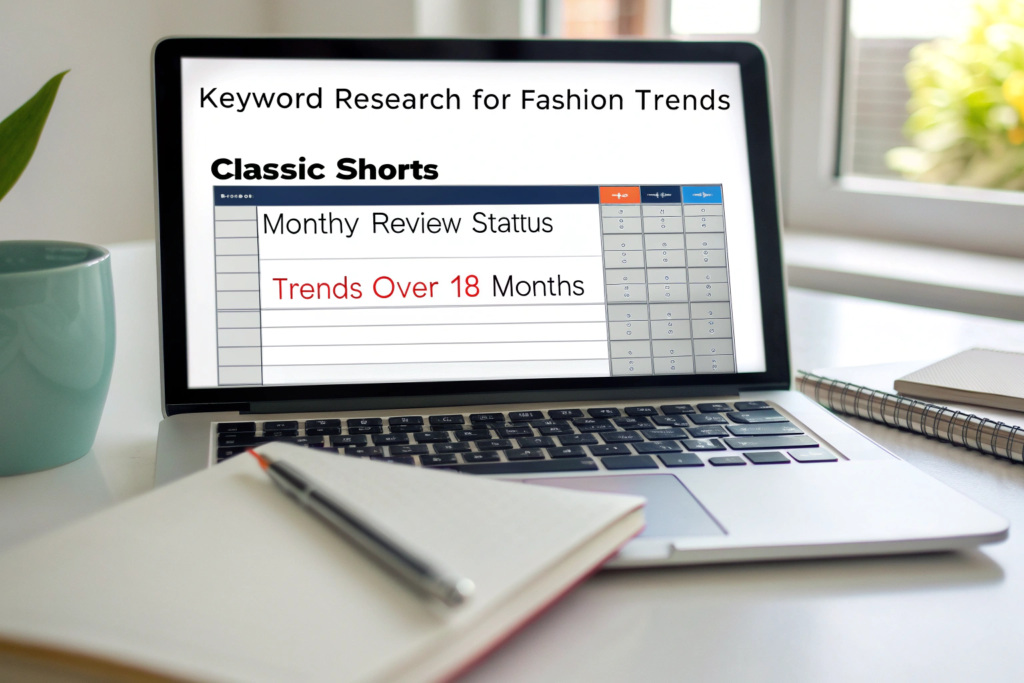
I track about 30 specific terms related to classic shorts. I review them monthly. I look for terms that show a sustained upward trend over at least 18 months, with accelerating growth in the last 6 months. A term that meets these criteria is a candidate for product development. The keyword research for fashion trends guide explains the methodology. Let's look at the specific terms you should be tracking for 2026 and beyond.
The silhouette, fabric, and feature terms are the three lenses. A style that combines a rising silhouette term, a rising fabric term, and a rising feature term is a trend with multiple confirmations. Let's examine the data for 2026.
What Are the Rising Silhouette Terms for 2026: Pleated, Wide Leg, Tailored?
The data for 2026 shows clear rising terms. "Pleated shorts" has been on a sustained upward trend for three years in the United States. The search interest has more than doubled since 2022. This is not a seasonal spike. It is a structural trend. "Wide leg shorts" is also rising, particularly in women's searches, driven by the broader shift away from skinny silhouettes. "Tailored shorts" is rising as the "quiet luxury" and "old money" aesthetics influence casual wear. Consumers are searching for shorts that look more polished and intentional.
The declining term is "skinny shorts." The search interest for this term has fallen steadily for five years. It is not a classic style. It was a trend that has passed. The stable terms are "chino shorts," "denim shorts," and "cargo shorts." These are the perennial classics. They do not show dramatic growth, but they maintain consistent search volume year after year. The Google Trends data for shorts styles is publicly available. The trend is clear.
How Do Fabric and Feature Terms Like "Linen Shorts" and "Elastic Waist" Signal Demand?
Fabric terms reveal material preferences. "Linen shorts" has been rising steadily for five years, with peak searches in April through July. The growth is driven by the breathability benefit in a warming climate and the association with vacation and luxury. "Stretch chino shorts" is a stable, high-volume term. Consumers expect comfort stretch. Feature terms reveal functional desires. "Elastic waist shorts" has shown a notable rise, particularly since 2021. This is the comfort-driven shift accelerated by the pandemic. "Drawstring shorts" is also rising, driven by the casualization of workwear and the athleisure influence. "Cuffed shorts" is a stable term associated with tailored, vintage-inspired looks.
A product that combines rising terms, "pleated" plus "linen" plus "elastic waist," is a product that has multiple demand signals converging. A brand that launches a pleated linen short with a hidden elastic waistband is aligning with three verified search trends. The Google Trends comparison for fabric and feature terms allows you to test these combinations.
How Do You Read the Data to Time Your Production Calendar?
Data without action is useless. The most valuable insight from Google Trends is the timing insight. Search data shows you exactly when consumer interest begins to rise each year, when it peaks, and when it declines. This seasonal pattern allows you to work backward from the peak to schedule your production. A product that arrives after the peak has missed the market. A product that arrives just as the search curve is climbing captures the early demand and sells through at full price.
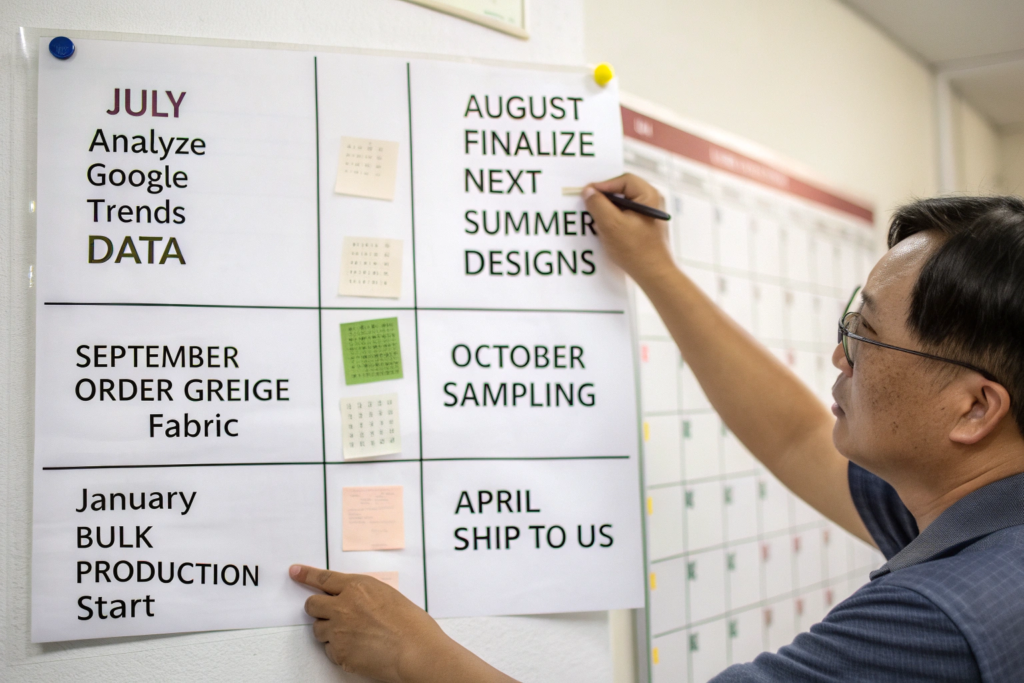
I use the seasonal search patterns to advise my clients on their production timelines. If the data shows that searches for "linen shorts" begin to rise in March, peak in June, and decline in August, the product needs to be in stores by March. That means bulk production must start in January. That means sampling must happen in October. That means design decisions must be finalized in August. The apparel production calendar and lead times guide explains the reverse scheduling process. Google Trends provides the target dates.
The seasonal curve is a map of consumer intent. The regional breakout shows where the early adopters are. Combining seasonal and regional data gives you a precise timing and targeting strategy.
What Do the Seasonal Search Curves Tell You About the Best Launch Months?
The seasonal curves for classic shorts are consistent. Searches begin to rise in March. They accelerate in April and May. They peak in June. They remain high in July. They begin to decline in August. They drop off sharply in September. This pattern repeats every year. The launch months for a new style should be March or April. This allows the product to be available as the search volume is rising. The product pages have time to be indexed by Google and accumulate reviews before the peak.
A product launched in June misses the rising curve and arrives at the peak. It captures some sales, but misses the early momentum. A product launched in August arrives as the curve is declining. It will likely need to be marked down. The seasonal search trends for apparel guide provides strategies for using seasonal data. The search curve is the ideal inventory arrival curve.
How Can You Use Regional Breakout Data to Identify Trend-Starting Cities?
Google Trends allows you to drill down to the metropolitan area level. This is powerful. Trends often start in specific cities and radiate outward. New York, Los Angeles, and San Francisco are often early adopters for fashion trends. Austin, Nashville, and Portland are also influential. If you see a search term like "pleated shorts" spiking in Los Angeles and New York, while remaining flat in the Midwest, the trend is likely in its early adopter phase. It has not yet reached the mass market. This is the ideal time to develop the product for the broader market.
The regional data also tells you where to focus your initial marketing. A brand can target digital ads to the cities where search interest is already high, capturing the existing demand while building awareness in the next tier of cities. The Google Trends geographic analysis for marketing guide explains this targeting strategy.
How Do You Translate Google Trends Insights into a Product Development Brief?
The final step is translation. The data tells you what consumers are searching for. You must translate those search terms into a specific product specification. A rising search for "pleated shorts" does not tell you the pleat depth, the inseam length, or the fabric. That is where your design expertise and your factory's technical capability come in. The data provides the direction. You provide the design execution.
I help our brand partners translate Google Trends data into tech packs. A client comes to me with data showing rising searches for "wide leg shorts" and "linen blend." We look at our pattern library. We select our wide-leg trouser short block. We select our 55% linen, 45% cotton blend fabric. We add a paperbag waist detail, which is another rising feature term. We create a product that is directly informed by verified consumer demand. The design brief creation from market data guide provides a framework.
The product development brief is the document that bridges the data and the factory. It includes the trend rationale, the key features, and the target timeline. Let's look at how to write this brief and how to avoid overreacting to short-lived data spikes.

How Do You Write a Product Brief That Connects Data to Design Features?
The product brief should include a section titled "Market Data Rationale." This section summarizes the Google Trends data that supports the product. "Search interest for 'pleated shorts' has grown 140% in the US over the past 3 years, with accelerating growth in the last 12 months. This indicates a sustained trend, not a seasonal fad." This data gives the design team confidence that they are not designing in a vacuum.
The brief should then specify the key design features, each linked to a data point. "Single forward pleat, driven by the rising 'pleated shorts' trend." "55% linen blend, driven by the rising 'linen shorts' trend." "Hidden elastic back waistband, driven by the rising 'elastic waist shorts' trend." The brief should include the target retail price, the target launch date, and the initial order quantity. The product brief template for fashion brands provides a structure. The data provides the justification.
What Are the Limits of Google Trends Data, and How Do You Avoid False Signals?
Google Trends data is relative, not absolute. It shows search interest relative to the peak for the selected time period. A spike in a niche term can look dramatic on the graph but represent a small absolute number of searches. Compare the rising term to a stable, high-volume term like "chino shorts" to gauge the relative scale. A term that is spiking but is still a tiny fraction of "chino shorts" volume is an early-stage trend, not a mass-market opportunity yet.
Google Trends data does not tell you why people are searching. It does not tell you if they are searching to buy or just browsing. Use Google Trends in combination with other data sources. Your own sales data. Retailer feedback. Trade show conversations. Production inquiries. When multiple data sources point in the same direction, the signal is strong. The limitations of Google Trends for market forecasting article explains the tool's constraints. Use it wisely, in context, as one input into a broader decision-making process.
Conclusion
Google Trends is a free, powerful, and underutilized tool for predicting the next big classic shorts style. By configuring the time range, geography, and category filters correctly, you can extract data that is relevant to the US apparel market. By tracking specific silhouette, fabric, and feature search terms, you can identify rising trends like pleated shorts, linen shorts, and elastic waist shorts. By analyzing seasonal curves, you can time your production to launch just as demand is accelerating. By drilling into regional data, you can spot early adopters. By translating the data into a product development brief, you can brief your factory with confidence.
The brands that win are not the ones with the best guesses. They are the ones with the best data. Google Trends puts powerful data at your fingertips. Use it to replace guesswork with insight. Use it to brief your factory with confidence. Use it to launch products that meet real, measurable, rising consumer demand.
At Shanghai Fumao, we work with brands that use data to drive their product decisions. We can take a data-informed product brief and turn it into a sample in weeks. Our pattern library includes the rising silhouettes. Our fabric inventory includes the rising materials. We are ready to help you act on your insights. If you have identified a trend and want to develop a product, contact our Business Director, Elaine, at elaine@fumaoclothing.com. Send her your data and your ideas. She will prepare a development plan and a sample timeline. Let us turn your trend data into your next best-selling short.