In today’s fast-moving apparel supply chain, evaluating a factory’s efficiency isn’t just about how many garments it produces—it’s about how well it produces them. From costing and on-time delivery to worker productivity and quality, key metrics can make or break a brand’s success.
The most important metrics for evaluating garment factory efficiency include SAM, line efficiency, on-time delivery rate, DHU, WIP, and cost per minute.
As a garment manufacturer exporting to the U.S. and Europe, we work closely with our clients to share transparent performance indicators so they can plan confidently. In this article, I’ll walk you through the essential KPIs and how to interpret them in real-world sourcing decisions.
What Productivity Metrics Should You Track on the Factory Floor?
Efficiency on the production floor defines everything: cost, timeline, and scalability. The more productive a line is, the faster you can hit PO targets with fewer errors and lower overhead.
The most important production KPIs are SAM, line efficiency, and cost per minute. These tell you how fast and cost-effective your supplier truly is.

What Is SAM and Why Does It Matter?
SAM stands for Standard Allowed Minutes—the time allocated for a skilled worker to complete one garment under standard working conditions. It’s determined using motion studies and software like GSDCost.
Each garment has a base SAM value:
- T-shirt: ~6–8 minutes
- Shirt: ~18–22 minutes
- Jacket: ~35–45 minutes
If a factory completes a shirt with a SAM of 20 but takes 25, it indicates inefficiency. We use SAM to calculate costing, line planning, and productivity bonuses.
Learn more on SewGuide.
How Is Line Efficiency Calculated?
Line Efficiency (%) = (Total SAM Produced / Total Available Minutes) × 100
If 5 operators produce 200 pieces of a 10-SAM garment in 8 hours:
(200×10) / (5×480) × 100 = 83.3% efficiency
A well-optimized factory runs at 80–90% line efficiency. We track this in real-time using IE tools and share reports with clients every 7 days during production.
How Do Quality Metrics Affect Factory Efficiency?
A fast factory with high defect rates isn’t efficient—it’s expensive. That’s why true efficiency includes both speed and first-pass quality. Good factories focus on “right-first-time” output to minimize rework and returns.
Key quality KPIs like DHU and AQL sampling rate help you judge whether a supplier can meet quality standards at volume.
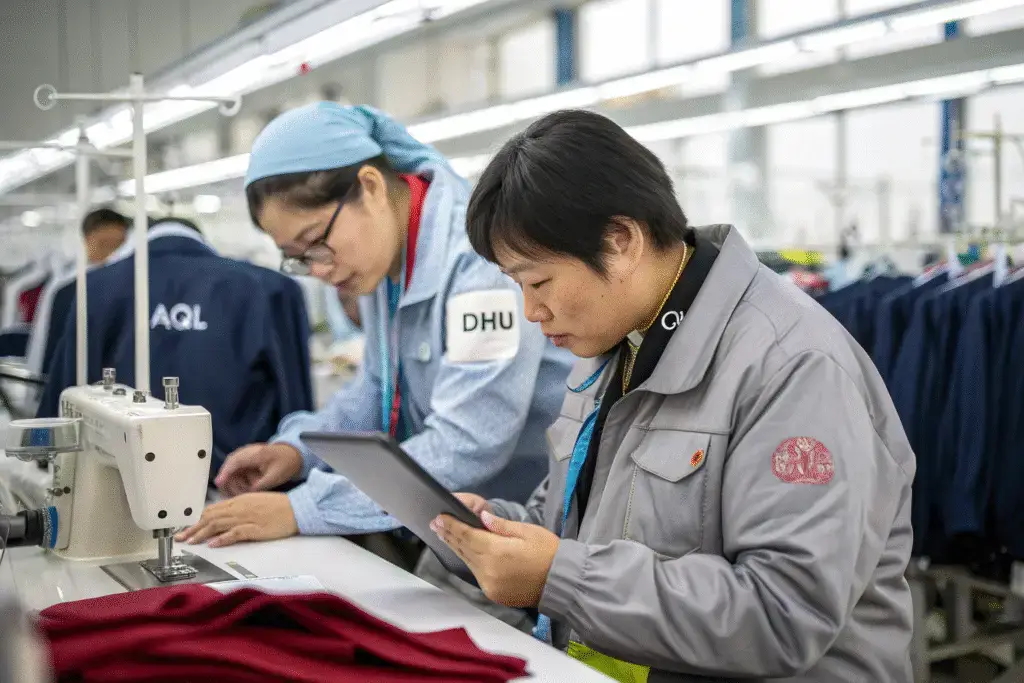
What Is DHU and What’s a Good Benchmark?
DHU = Defects per Hundred Units. It’s calculated as:
DHU = (Total Defects Found / Total Units Checked) × 100
For example, if 12 defects are found in 300 checked garments:
(12 / 300) × 100 = 4% DHU
A DHU below 3% is considered excellent. Above 5% indicates frequent rework. We maintain under 2.5% on most export orders and track DHU at inline and final inspection stages.
Explore more at Fibre2Fashion.
How Is AQL Used in Bulk Inspections?
AQL = Acceptable Quality Level, a standard sampling method. For most fashion buyers:
- AQL 2.5 = strict quality
- AQL 4.0 = general consumer wear
- AQL 1.5 = luxury or high-compliance markets
We conduct AQL inspections using tables provided by ASQ. These determine how many pieces are inspected and what defect limits are allowed.
Passing AQL inspections on the first attempt is a hallmark of efficiency.
How Can Time-Based Metrics Improve Order Planning?
Apparel production is deadline-driven. Brands need to know when goods will ship—and how efficiently the factory stays on schedule. This makes timeline metrics just as important as cost or quality.
Use OTIF, WIP tracking, and lead time adherence to evaluate whether your factory is delivery efficient.

What Is OTIF and Why Is It Critical?
OTIF = On Time In Full. It measures whether a supplier delivered all products by the committed deadline.
We calculate it as:
OTIF (%) = (Orders Delivered On Time and In Full / Total Orders Shipped) × 100
A good factory maintains >90% OTIF rate. Missing delivery windows affects retailers, damages buyer trust, and increases air freight risk. Our OTIF in 2024: 96.2%.
Read more on SupplyChainDigital for OTIF best practices.
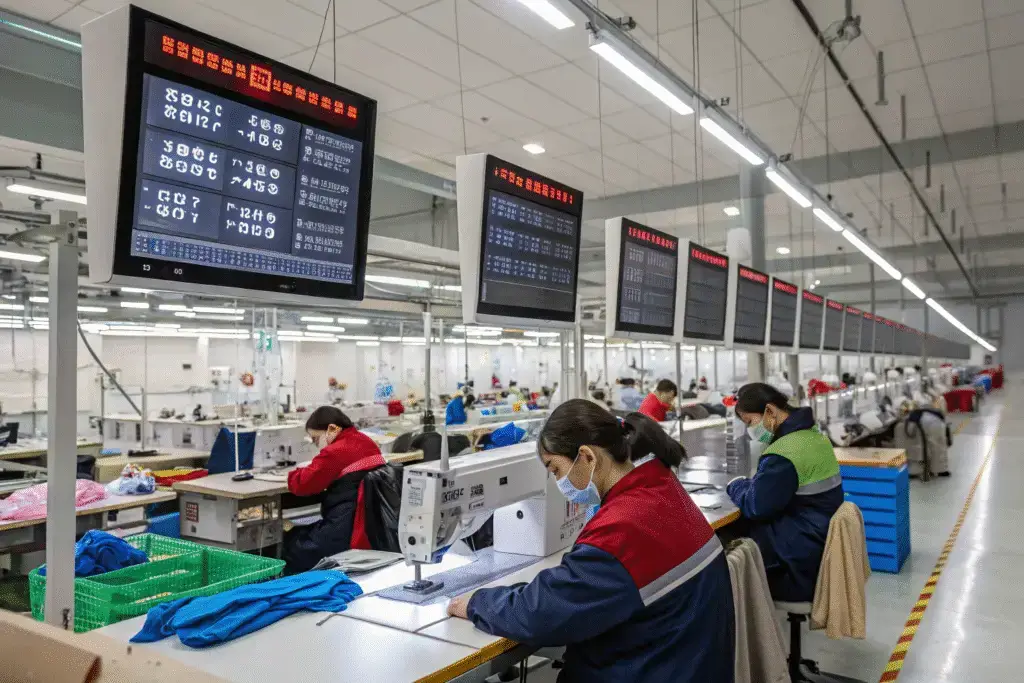
How Does WIP Help You Predict Delays?
WIP = Work In Progress. Monitoring it in real time gives buyers visibility into delays before they happen.
We segment WIP by:
- Cutting
- Sewing
- Finishing
- Packing
Our clients get weekly WIP snapshots through Google Sheets and ClickUp. This lets them align marketing, shipping, and inventory.
Factories that delay WIP reporting often hide production issues.
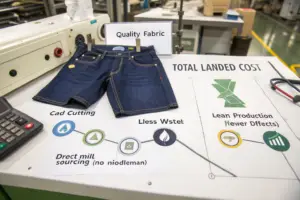
What Financial Metrics Indicate Operational Health?
Behind every efficient operation is a strong financial model. Understanding the cost structure at factory level allows you to negotiate smarter and avoid surprises.
Metrics like cost per minute, idle time percentage, and overhead-to-output ratio help buyers assess pricing fairness and long-term partnership potential.
What Is Cost Per Minute and How Is It Calculated?
Cost per Minute (CPM) = (Total Factory Cost / Total Available Minutes)
If a factory runs 300 machines for 8 hours:
Total Minutes = 300 × 480 = 144,000 mins
If monthly fixed + variable cost is $54,000:
CPM = $54,000 / 144,000 = $0.375 per min
If your shirt takes 18 SAM:
Total labor cost = 18 × 0.375 = $6.75
This helps benchmark against global rates. Bangladesh is ~$0.24/min, China ~$0.40–$0.45. For reference, see Just-Style.
What Other Financial KPIs Should Buyers Consider?
Other key metrics include:
- Idle time %: time operators wait for inputs or repairs
- Overtime ratio: high levels indicate poor planning
- Utility cost per piece: electricity, steam, compressed air per unit
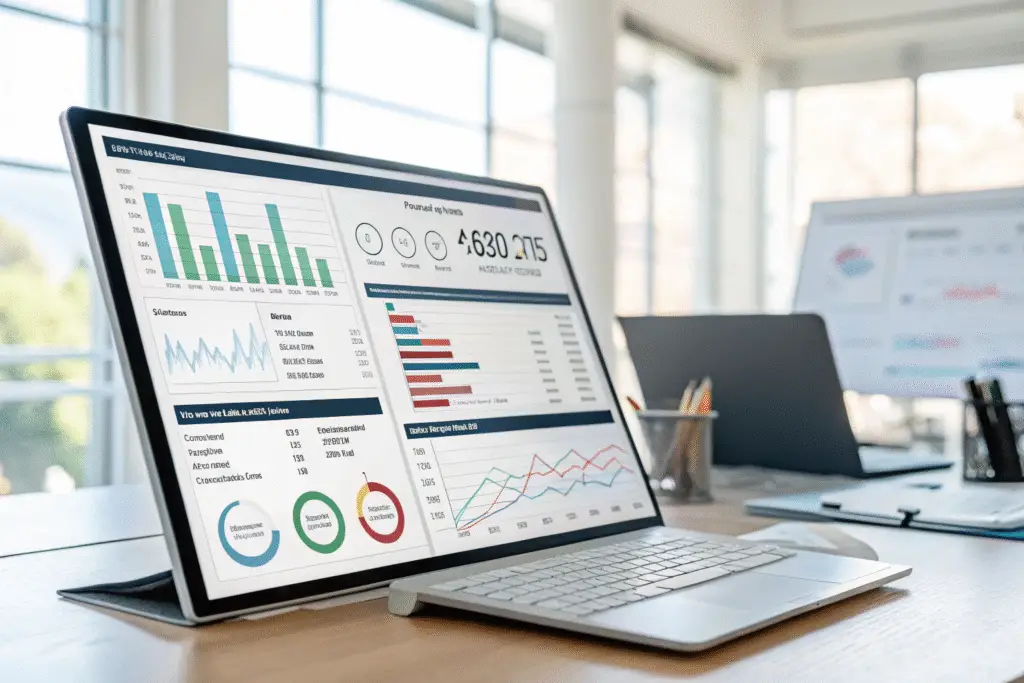
We maintain financial dashboards using Zoho Books and offer transparency to high-volume clients.
Financial efficiency ensures long-term sustainability—not just price negotiation.
Conclusion
Evaluating a garment factory’s efficiency goes far beyond counting finished pieces. True efficiency blends speed, accuracy, cost control, and delivery precision into every garment made.
At Fumao Clothing, we measure every stitch—from SAM to shipment—using real-time KPIs. Whether you're a brand scaling up or a sourcing veteran like Ron, using the right metrics helps you select reliable partners and hit your margins.
The next time you audit a factory, don’t just ask for output numbers—ask for the dashboard behind them.